
May 2023
Jun 01, 2023
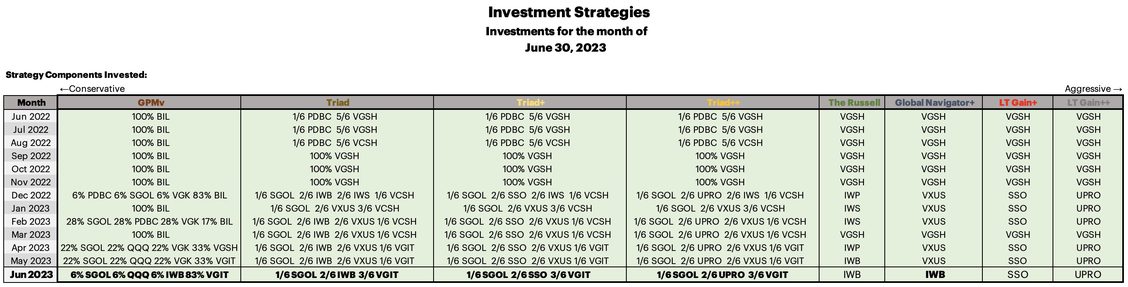
All in all it was a pretty flat month in May. There are a few changes to the strategies detailed below.
I *finally* got the ‘next month prediction’ of what the strategies will invest in posted to the site. Laurent was skilled and gracious enough to code the DMS strategies into Google Colab where you can run the strategies to see what they will be invested in as of the information on hand. Check it out on the website from the Menu select “Strategy Next Month”.
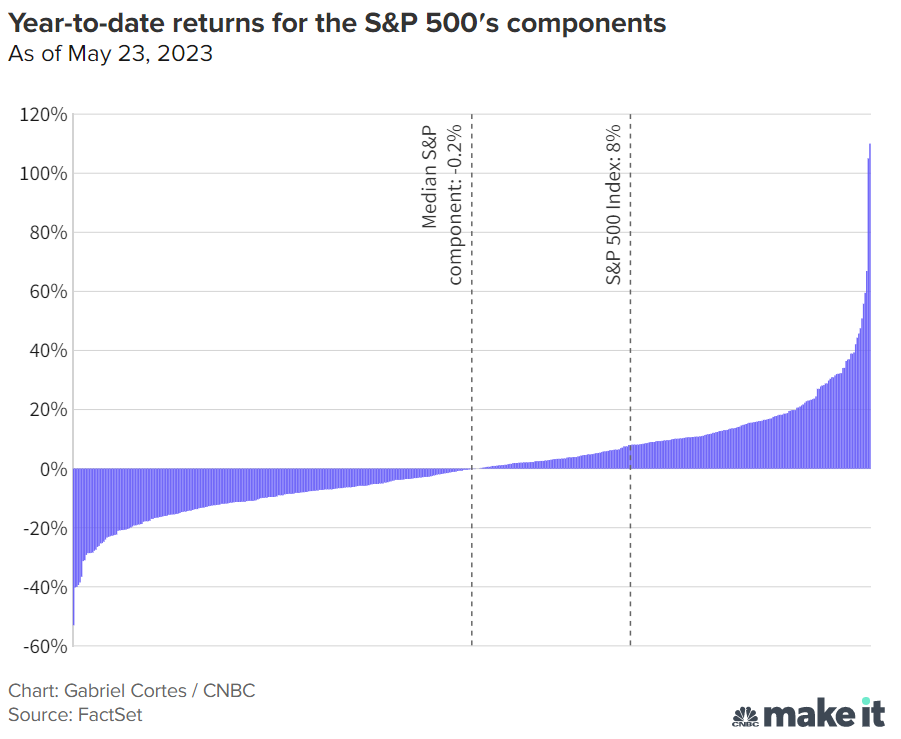
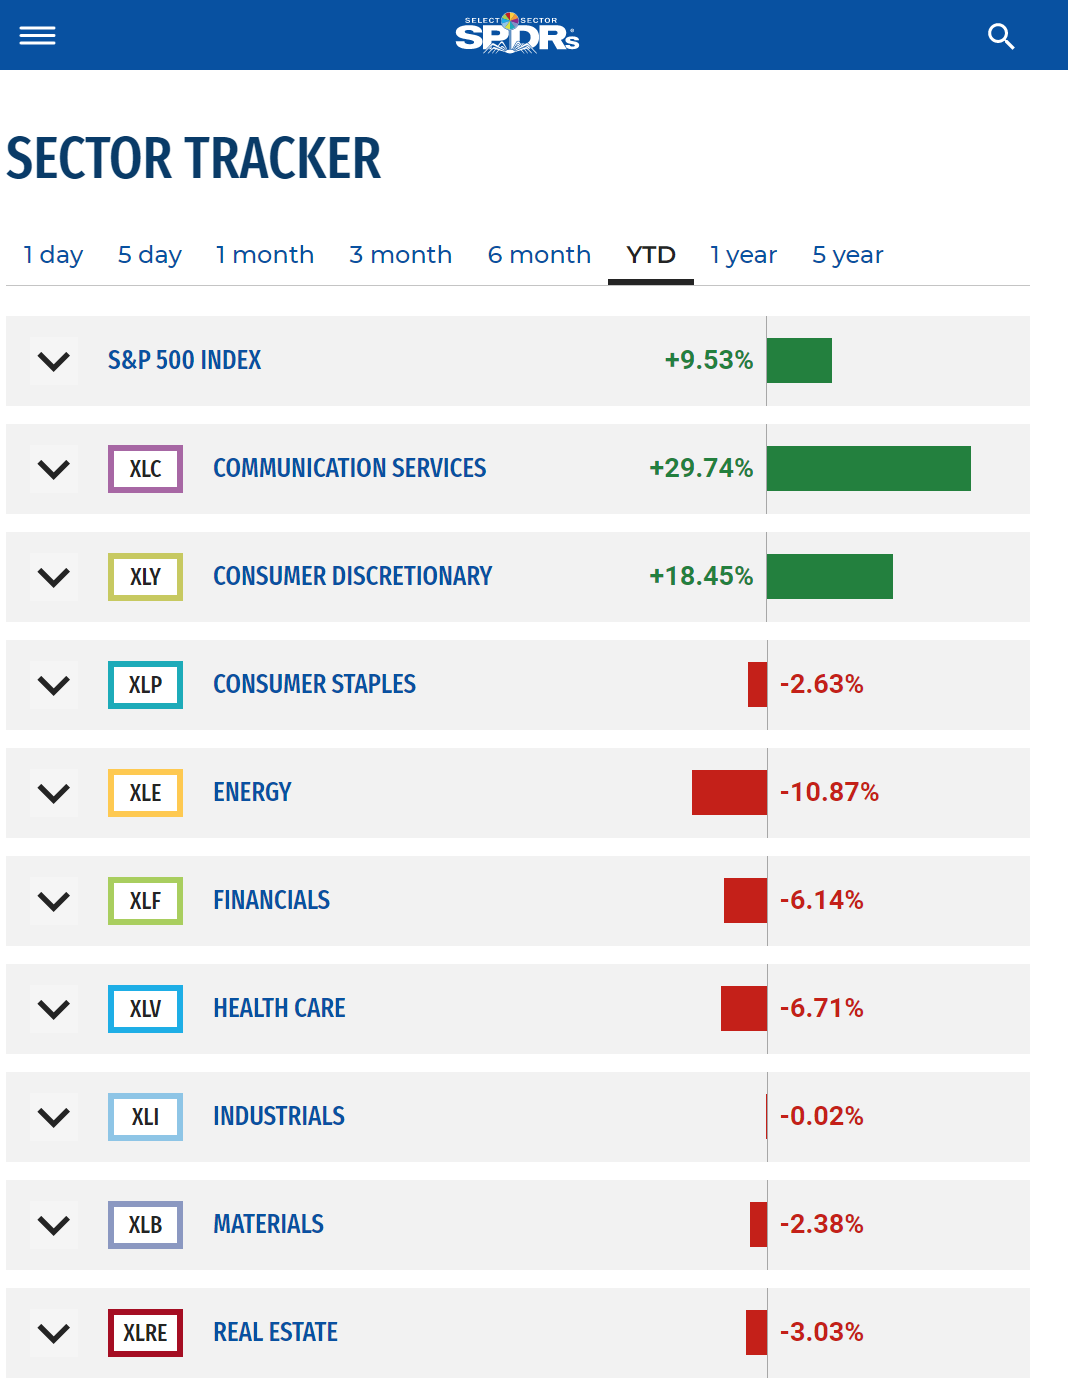
The broader markets are doing well this year, broader markets being defined as the S&P 500 or the Russell 1000. They are each up right around 9% year to date. This is a very narrow rise in the markets though, the breadth is not broad. As shown in the image just below (as of a week ago), you can see that all the gains have been the result of just a few stocks, the median component is actually negative on the year. Apple, Microsoft, Nvidia, Google, and Meta; these 5 stocks account for 80% of the S&P's positive performance year to date. In other words, if you aren't in Big Tech this year, you likely aren't faring nearly as well as the broader markets, (or the Q's.)
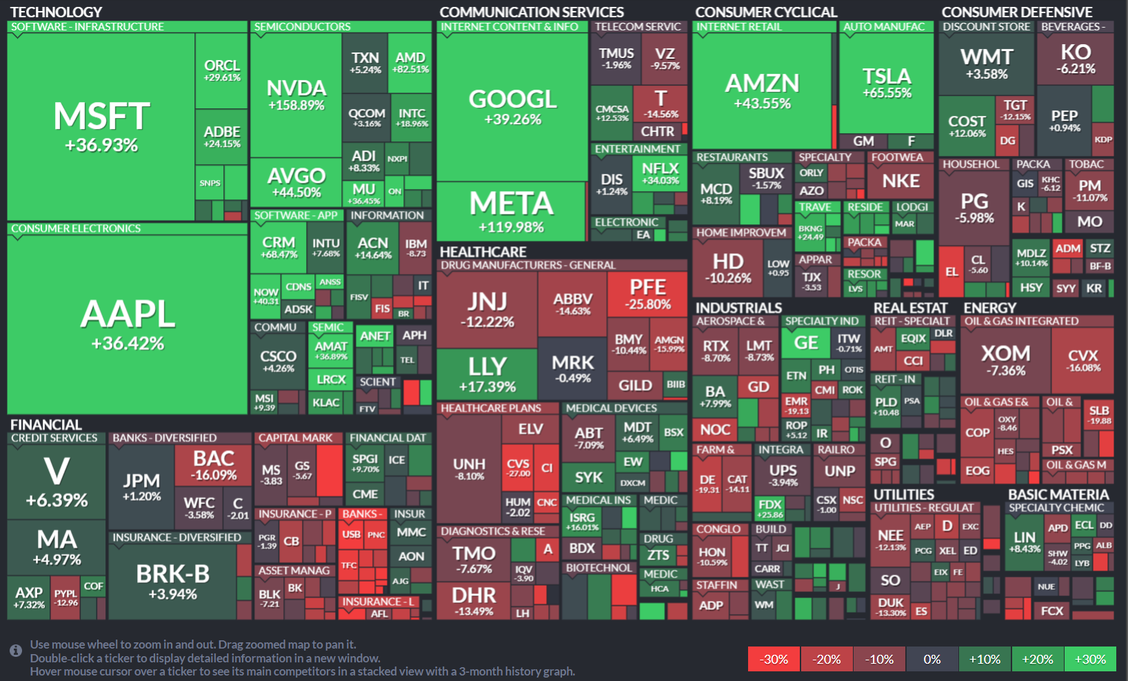
Yet another way to view it is from the Finviz Heatmap which shows that it's basically all tech in the green YTD.
Here is the allocation spreadsheet in case that helps working with multiple strategies. Just enter the percent allocated to the strategies, and the amount of money to allocate overall to the strategies, and it tells you which ETF’s that you should be holding in what quantities. Excel Allocation Workbook for June 2023.
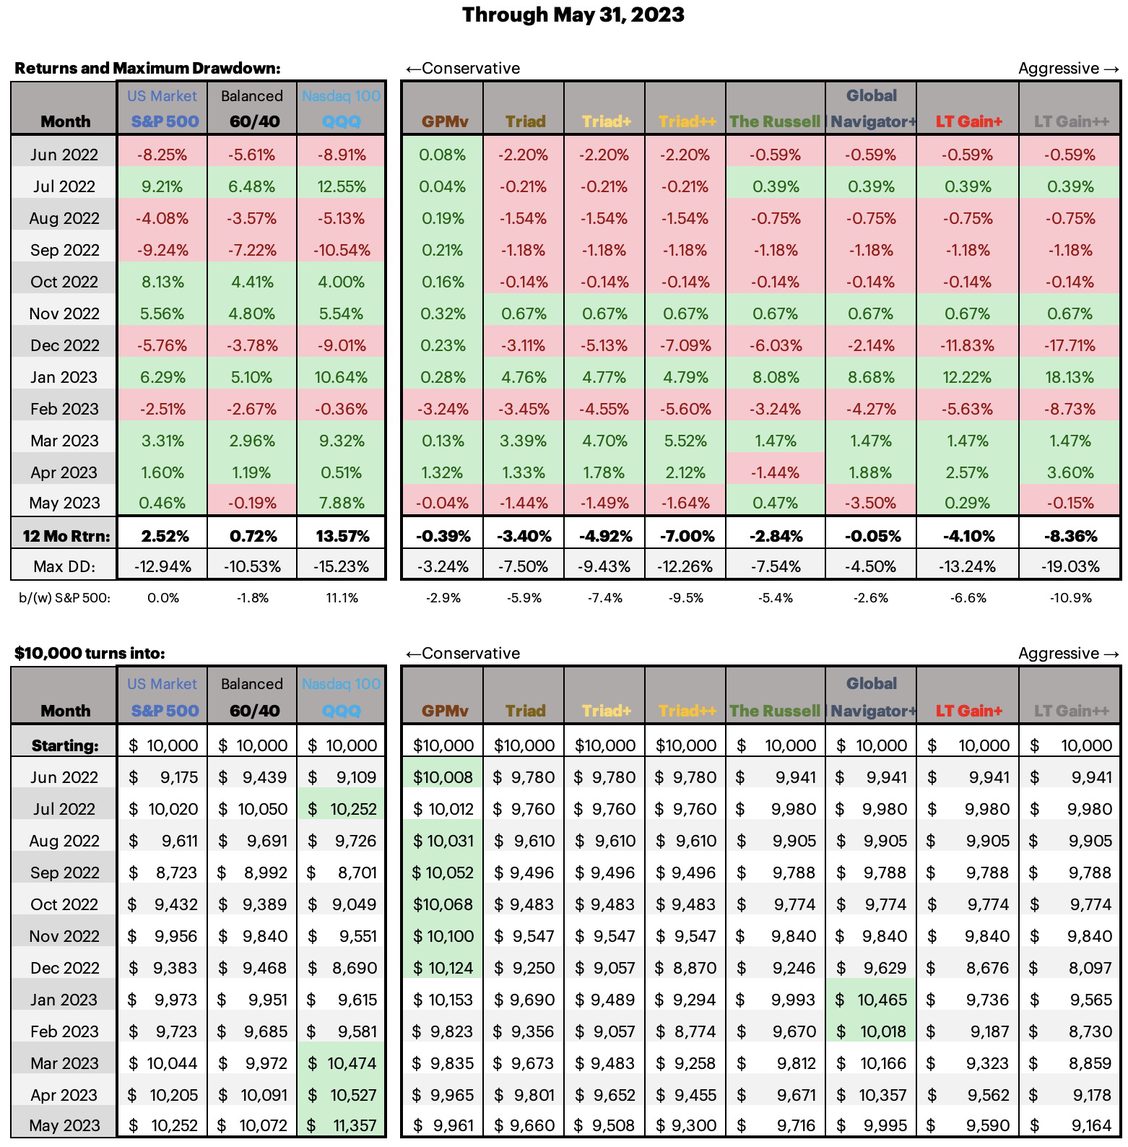
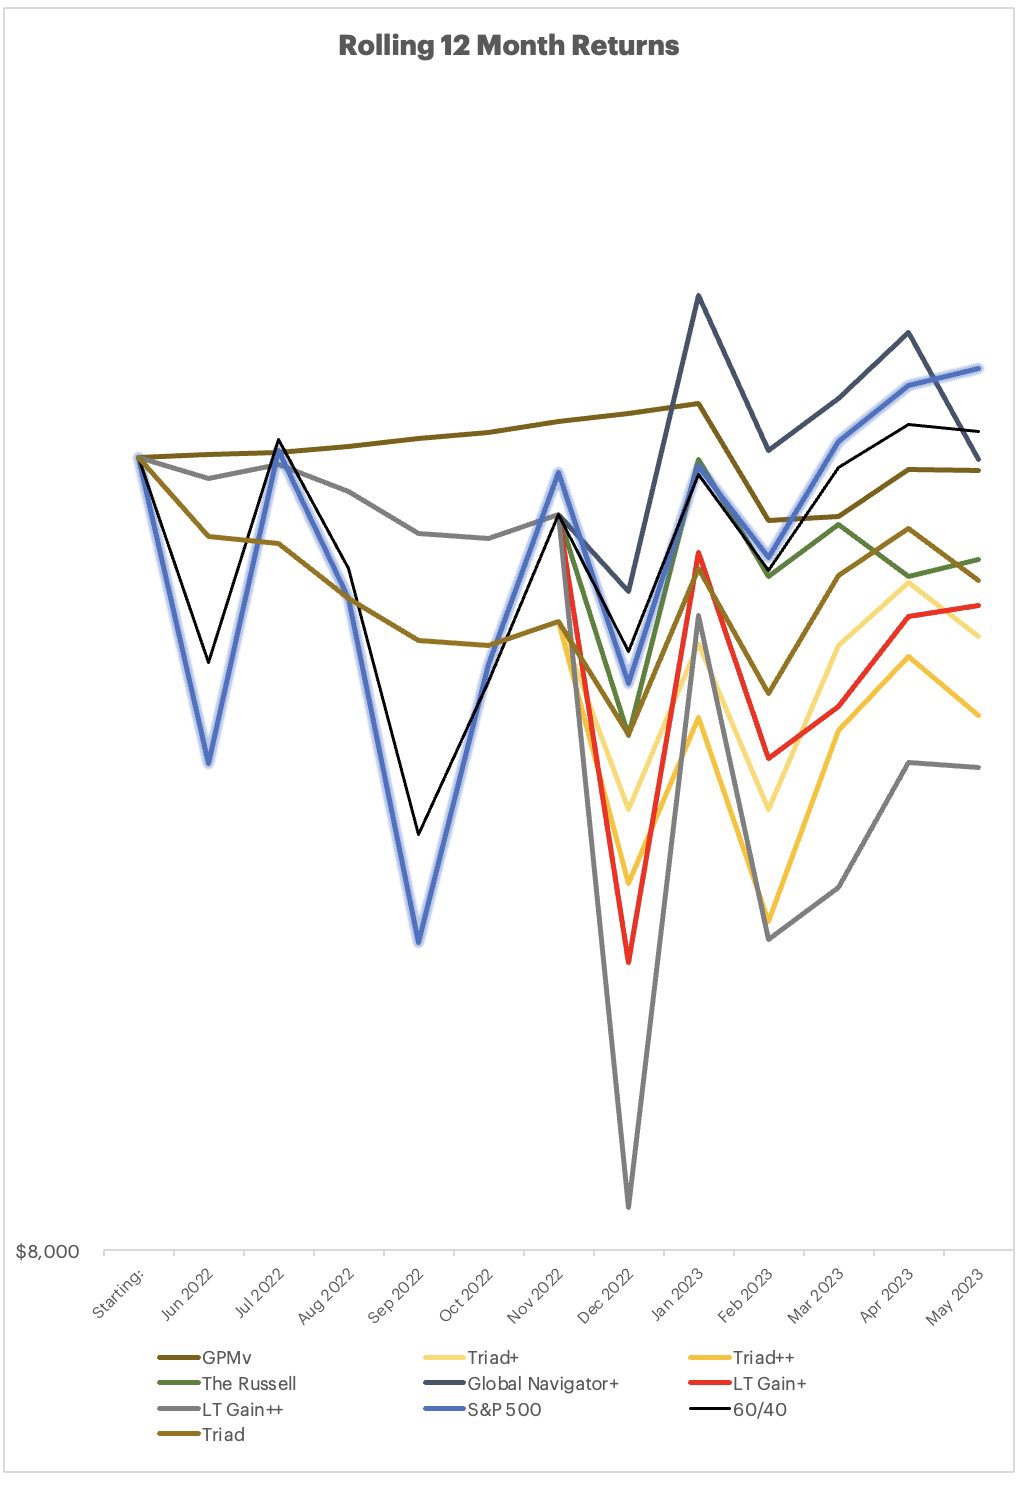
Here is a link to the May Reporting Deck
Don’t forget that you can track the strategies any day of the month from this URL.
Cheers
I *finally* got the ‘next month prediction’ of what the strategies will invest in posted to the site. Laurent was skilled and gracious enough to code the DMS strategies into Google Colab where you can run the strategies to see what they will be invested in as of the information on hand. Check it out on the website from the Menu select “Strategy Next Month”.
The broader markets are doing well this year, broader markets being defined as the S&P 500 or the Russell 1000. They are each up right around 9% year to date. This is a very narrow rise in the markets though, the breadth is not broad. As shown in the image just below (as of a week ago), you can see that all the gains have been the result of just a few stocks, the median component is actually negative on the year. Apple, Microsoft, Nvidia, Google, and Meta; these 5 stocks account for 80% of the S&P's positive performance year to date. In other words, if you aren't in Big Tech this year, you likely aren't faring nearly as well as the broader markets, (or the Q's.)
Yet another way to view it is from the Finviz Heatmap which shows that it's basically all tech in the green YTD.
Here is the allocation spreadsheet in case that helps working with multiple strategies. Just enter the percent allocated to the strategies, and the amount of money to allocate overall to the strategies, and it tells you which ETF’s that you should be holding in what quantities. Excel Allocation Workbook for June 2023.
Here is a link to the May Reporting Deck
Don’t forget that you can track the strategies any day of the month from this URL.
Cheers