July 2023
July 2023
Jul 29, 2023
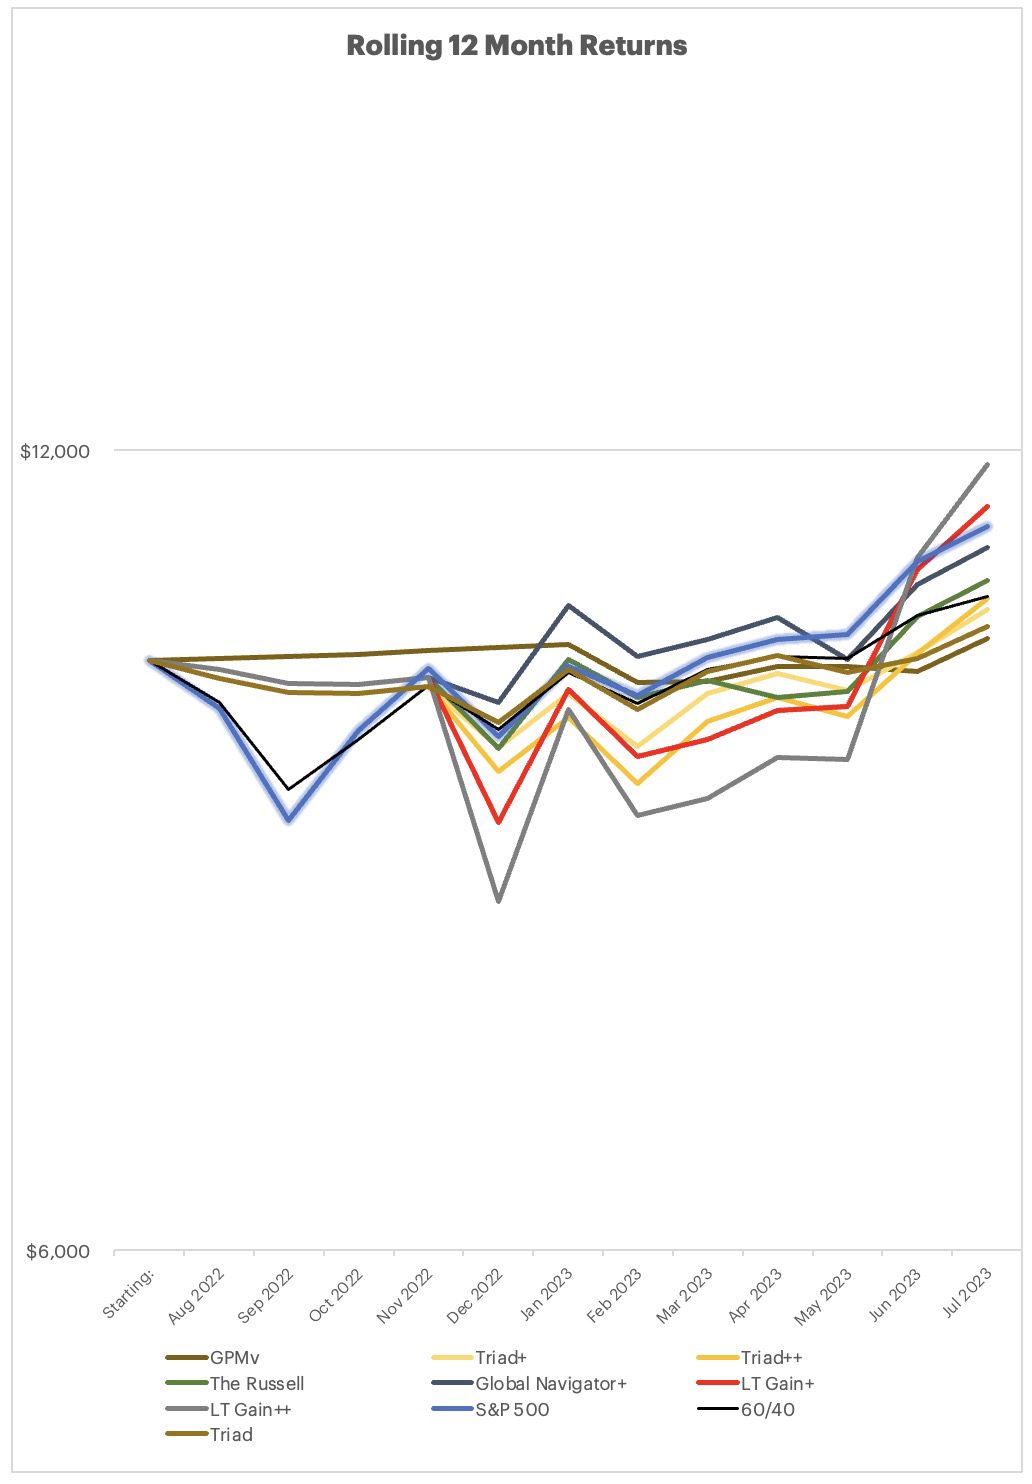
June was a fabulous month for the overall Market (at least as defined by the Russell 1000 (or the S&P 500). Ditto July, while not quite as big of gains as June, July continued the upward trend very nicely.

June 2023
Jul 24, 2023
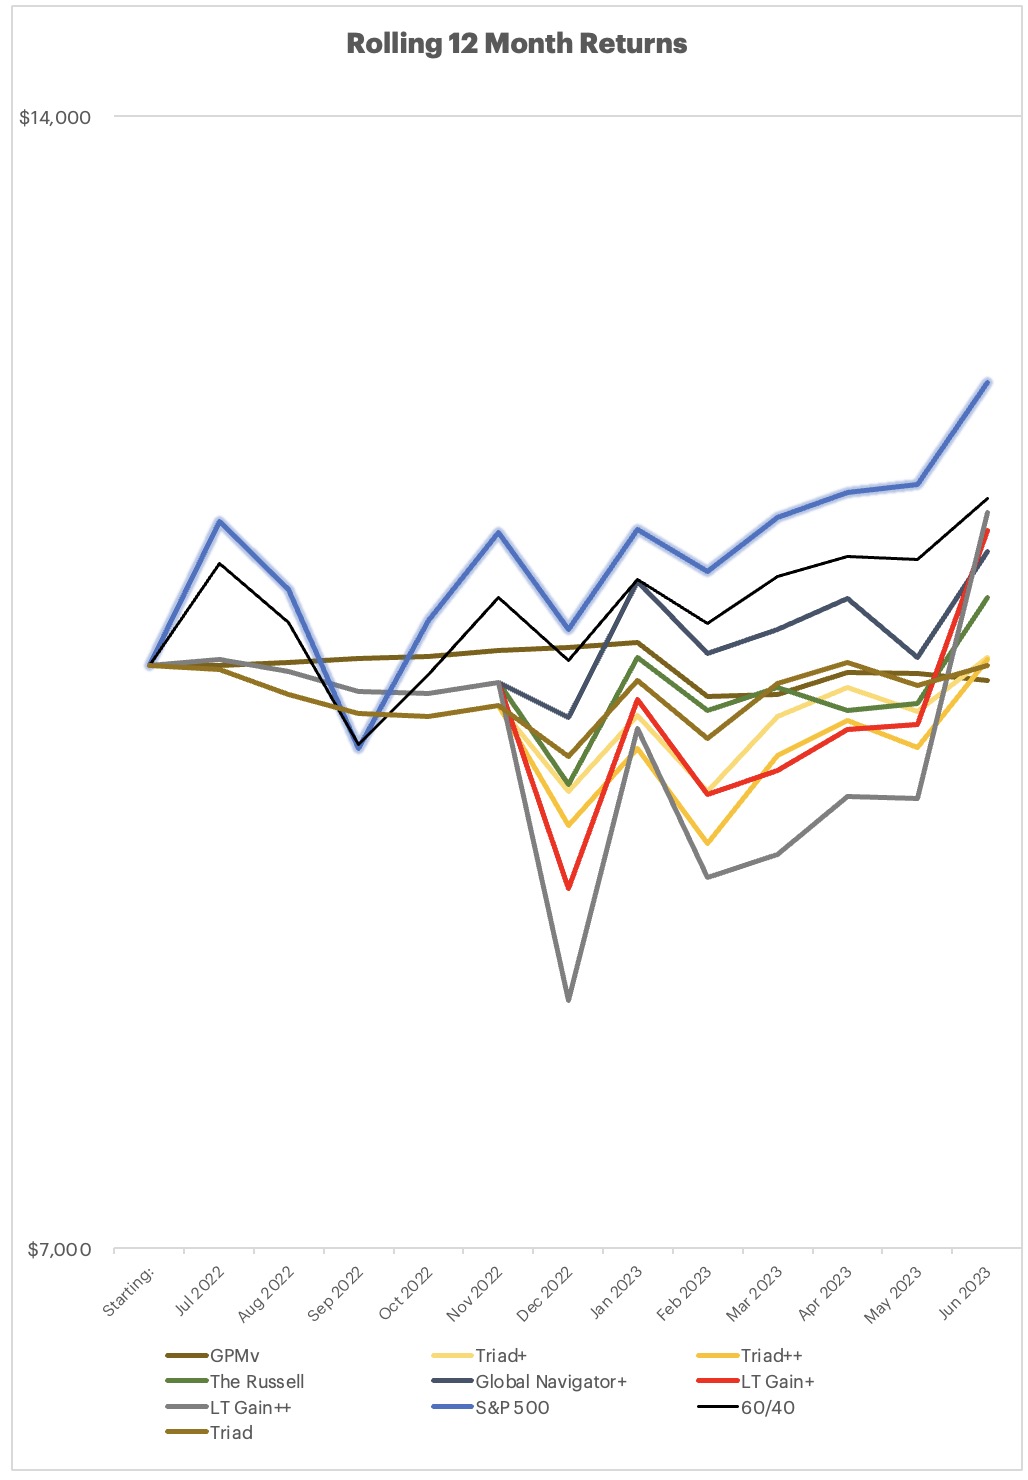
June was a fabulous month for the overall Market (at least as defined by the Russell 1000 (or the S&P 500).
Quick reminder to check out the Google Colab’s which show where the next months investments will be, if the month ends as it is when you run it. Laurent was skilled and gracious enough to code the DMS strategies into Google Colab where you can run the strategies to see what they will be invested in as of the information on hand. Check it out on the website from the Menu select “Strategy Next Month”.
This year has been a very narrow outperformance by a handful of stocks, which is driving up the major indexes of which they are a large part because they are market weighted indexes. It can often be advantageous to be diversified and hold investments different from the big indexes, however, it is not without some pain when seemingly only the big indexes are doing well. If your allocation isn’t performing as well as the big indexes this year, your time will come. It’s ok to look different and perform different than do the big indexes.
Small note, the version of Excel on my daily driver, an iMac, is having issues this month printing out the PDF, so I printed it out from my work machine which is Windows based - so if the reporting deck looks a little different, that is why.
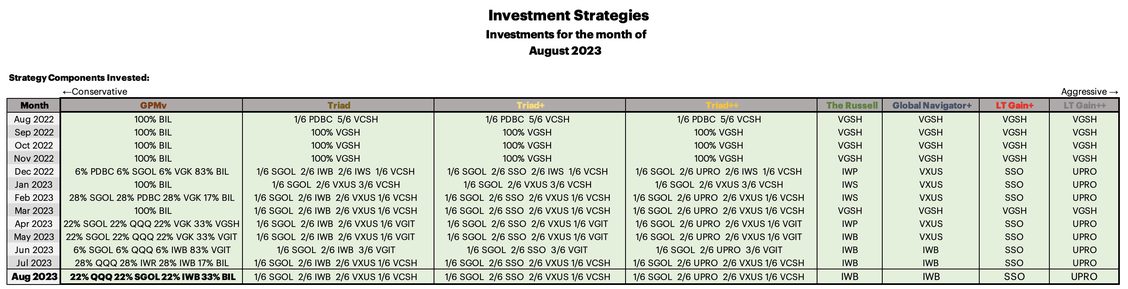
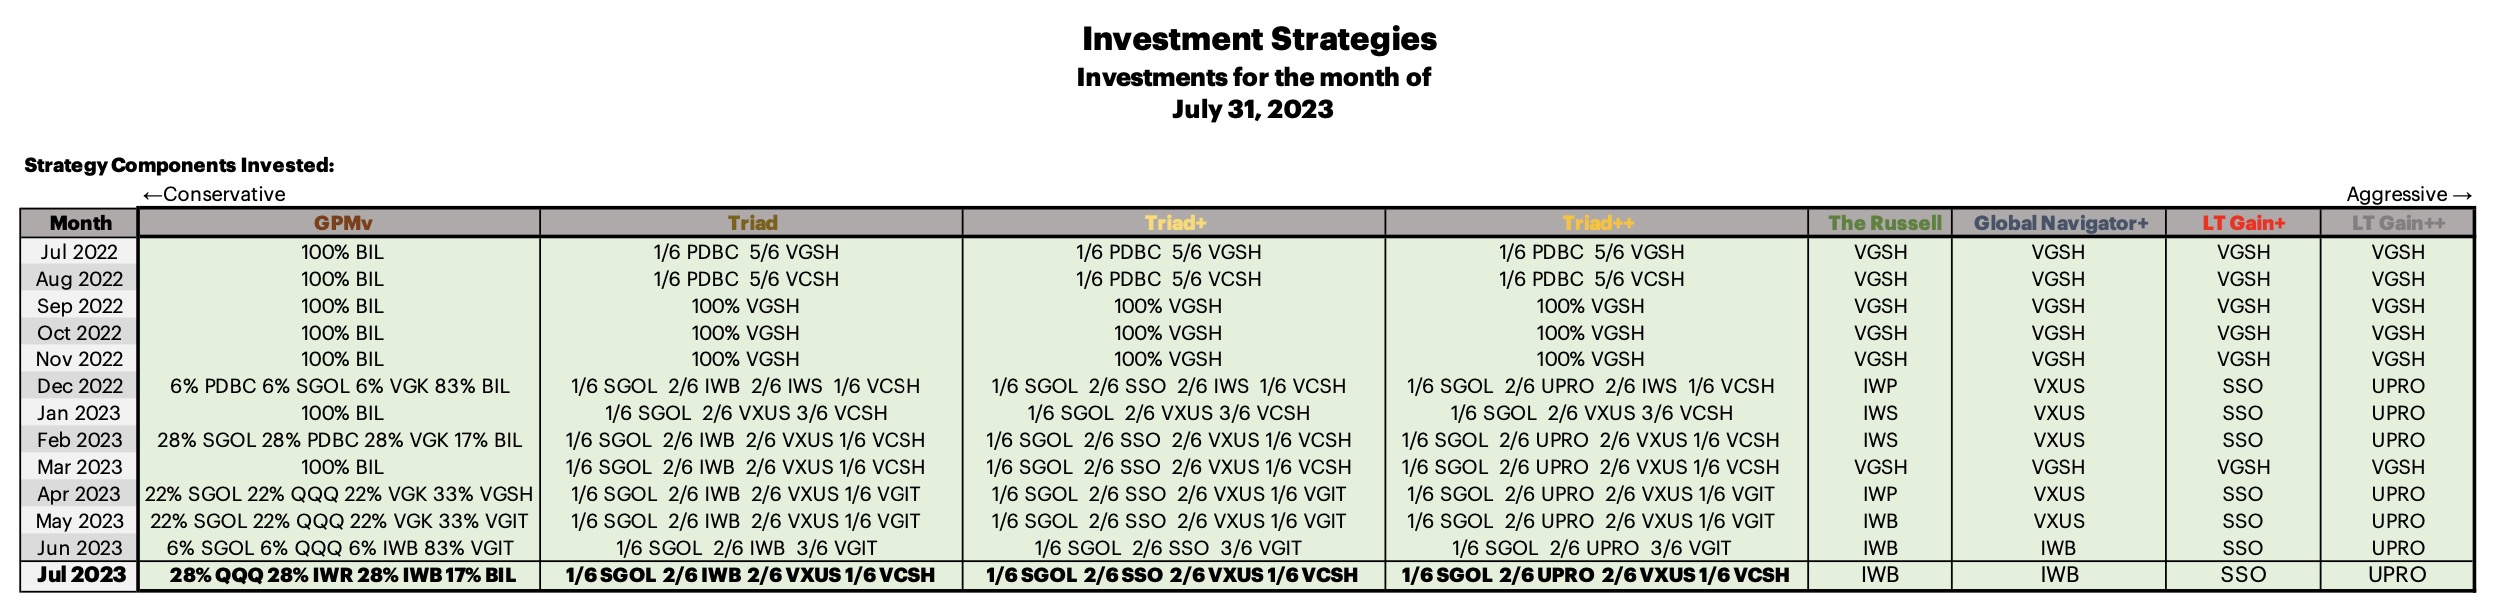
Very little change from June to July, outlined in the image below and in the Reporting Deck available here.
This year to date:
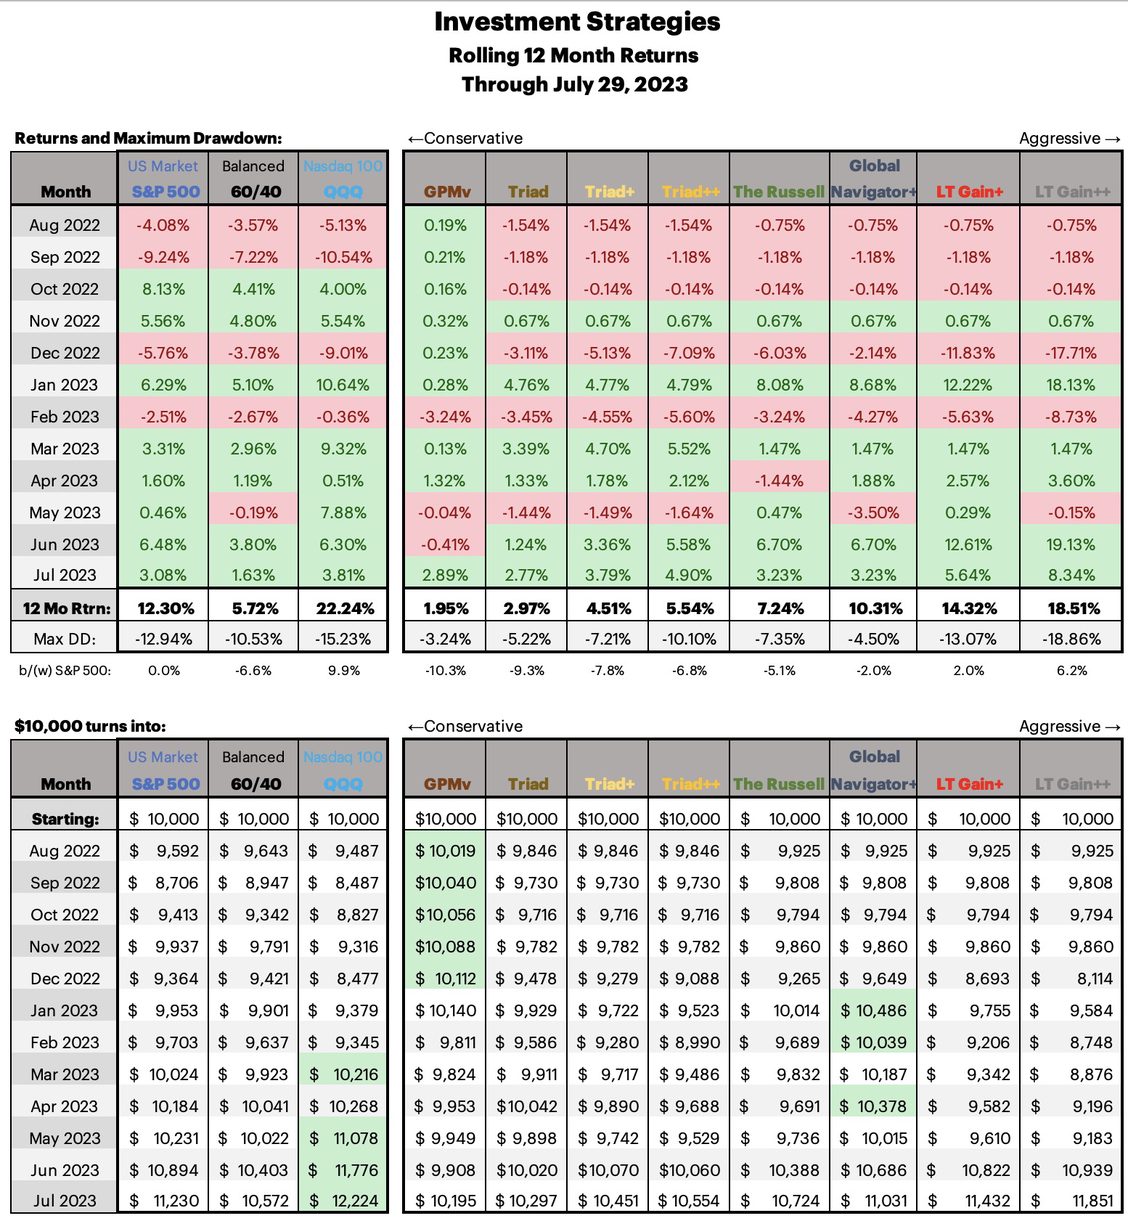
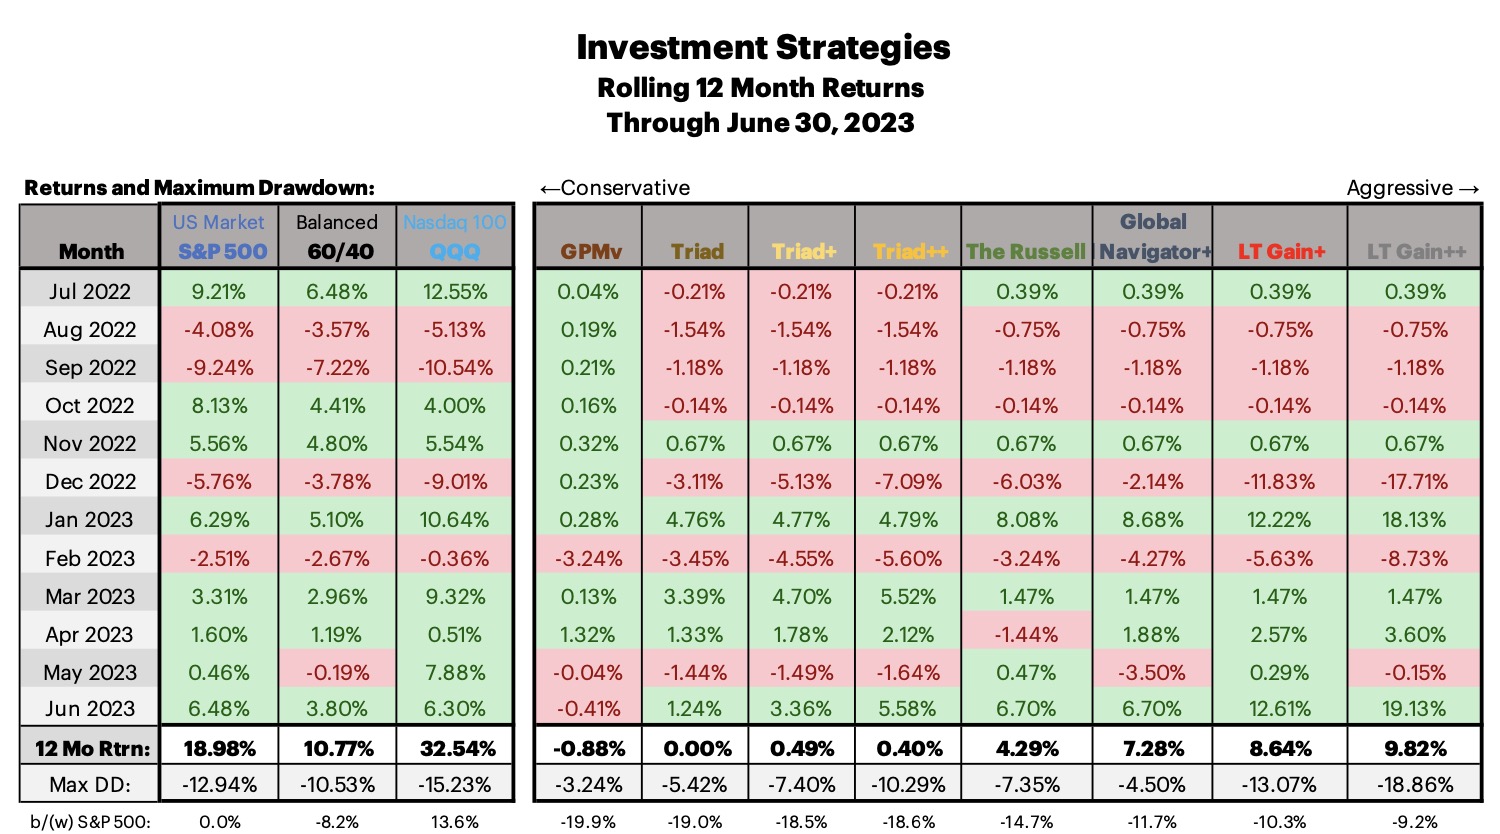
GPMv has relatively struggled this year, it is inherently a protective and cautious strategy. Note that GPMv is doing ever so slightly better than GPM year to date, both are slightly down.
Triad/Triad+/Triad++ are doing well and are up 5.73%/10.7%/12.12% YTD. Even though they are more cautious and far more diversified than the major markets, they are doing a great job this YTD.
The Russell has solid returns this year, it is ahead of a 60/40 and a bit behind the major markets, doing what it is supposed to do.
Global Navigator+ GN looks different than the market and will sometimes mimic its performance, other times not. GN was holding International in May when it underperformed. YTD GN+ is slightly ahead of a 60/40. It is not currently leveraged because when it went out of treasuries and into equities, International was the investment. By the time it switched to US equities it did so in unleveraged equities.
LT Gain+/LT Gain++ These strategies are doing fantastic YTD with returns of nearly 25% and 35%. They have been in leveraged US markets this year other than March when they hid out in treasuries.
Here is the allocation spreadsheet in case that helps working with multiple strategies. Just enter the percent allocated to the strategies, and the amount of money to allocate overall to the strategies, and it tells you which ETF’s that you should be holding in what quantities. Excel Allocation Workbook for July 2023.
Quick reminder to check out the Google Colab’s which show where the next months investments will be, if the month ends as it is when you run it. Laurent was skilled and gracious enough to code the DMS strategies into Google Colab where you can run the strategies to see what they will be invested in as of the information on hand. Check it out on the website from the Menu select “Strategy Next Month”.
This year has been a very narrow outperformance by a handful of stocks, which is driving up the major indexes of which they are a large part because they are market weighted indexes. It can often be advantageous to be diversified and hold investments different from the big indexes, however, it is not without some pain when seemingly only the big indexes are doing well. If your allocation isn’t performing as well as the big indexes this year, your time will come. It’s ok to look different and perform different than do the big indexes.
Small note, the version of Excel on my daily driver, an iMac, is having issues this month printing out the PDF, so I printed it out from my work machine which is Windows based - so if the reporting deck looks a little different, that is why.
Very little change from June to July, outlined in the image below and in the Reporting Deck available here.
This year to date:
GPMv has relatively struggled this year, it is inherently a protective and cautious strategy. Note that GPMv is doing ever so slightly better than GPM year to date, both are slightly down.
Triad/Triad+/Triad++ are doing well and are up 5.73%/10.7%/12.12% YTD. Even though they are more cautious and far more diversified than the major markets, they are doing a great job this YTD.
The Russell has solid returns this year, it is ahead of a 60/40 and a bit behind the major markets, doing what it is supposed to do.
Global Navigator+ GN looks different than the market and will sometimes mimic its performance, other times not. GN was holding International in May when it underperformed. YTD GN+ is slightly ahead of a 60/40. It is not currently leveraged because when it went out of treasuries and into equities, International was the investment. By the time it switched to US equities it did so in unleveraged equities.
LT Gain+/LT Gain++ These strategies are doing fantastic YTD with returns of nearly 25% and 35%. They have been in leveraged US markets this year other than March when they hid out in treasuries.
Here is the allocation spreadsheet in case that helps working with multiple strategies. Just enter the percent allocated to the strategies, and the amount of money to allocate overall to the strategies, and it tells you which ETF’s that you should be holding in what quantities. Excel Allocation Workbook for July 2023.