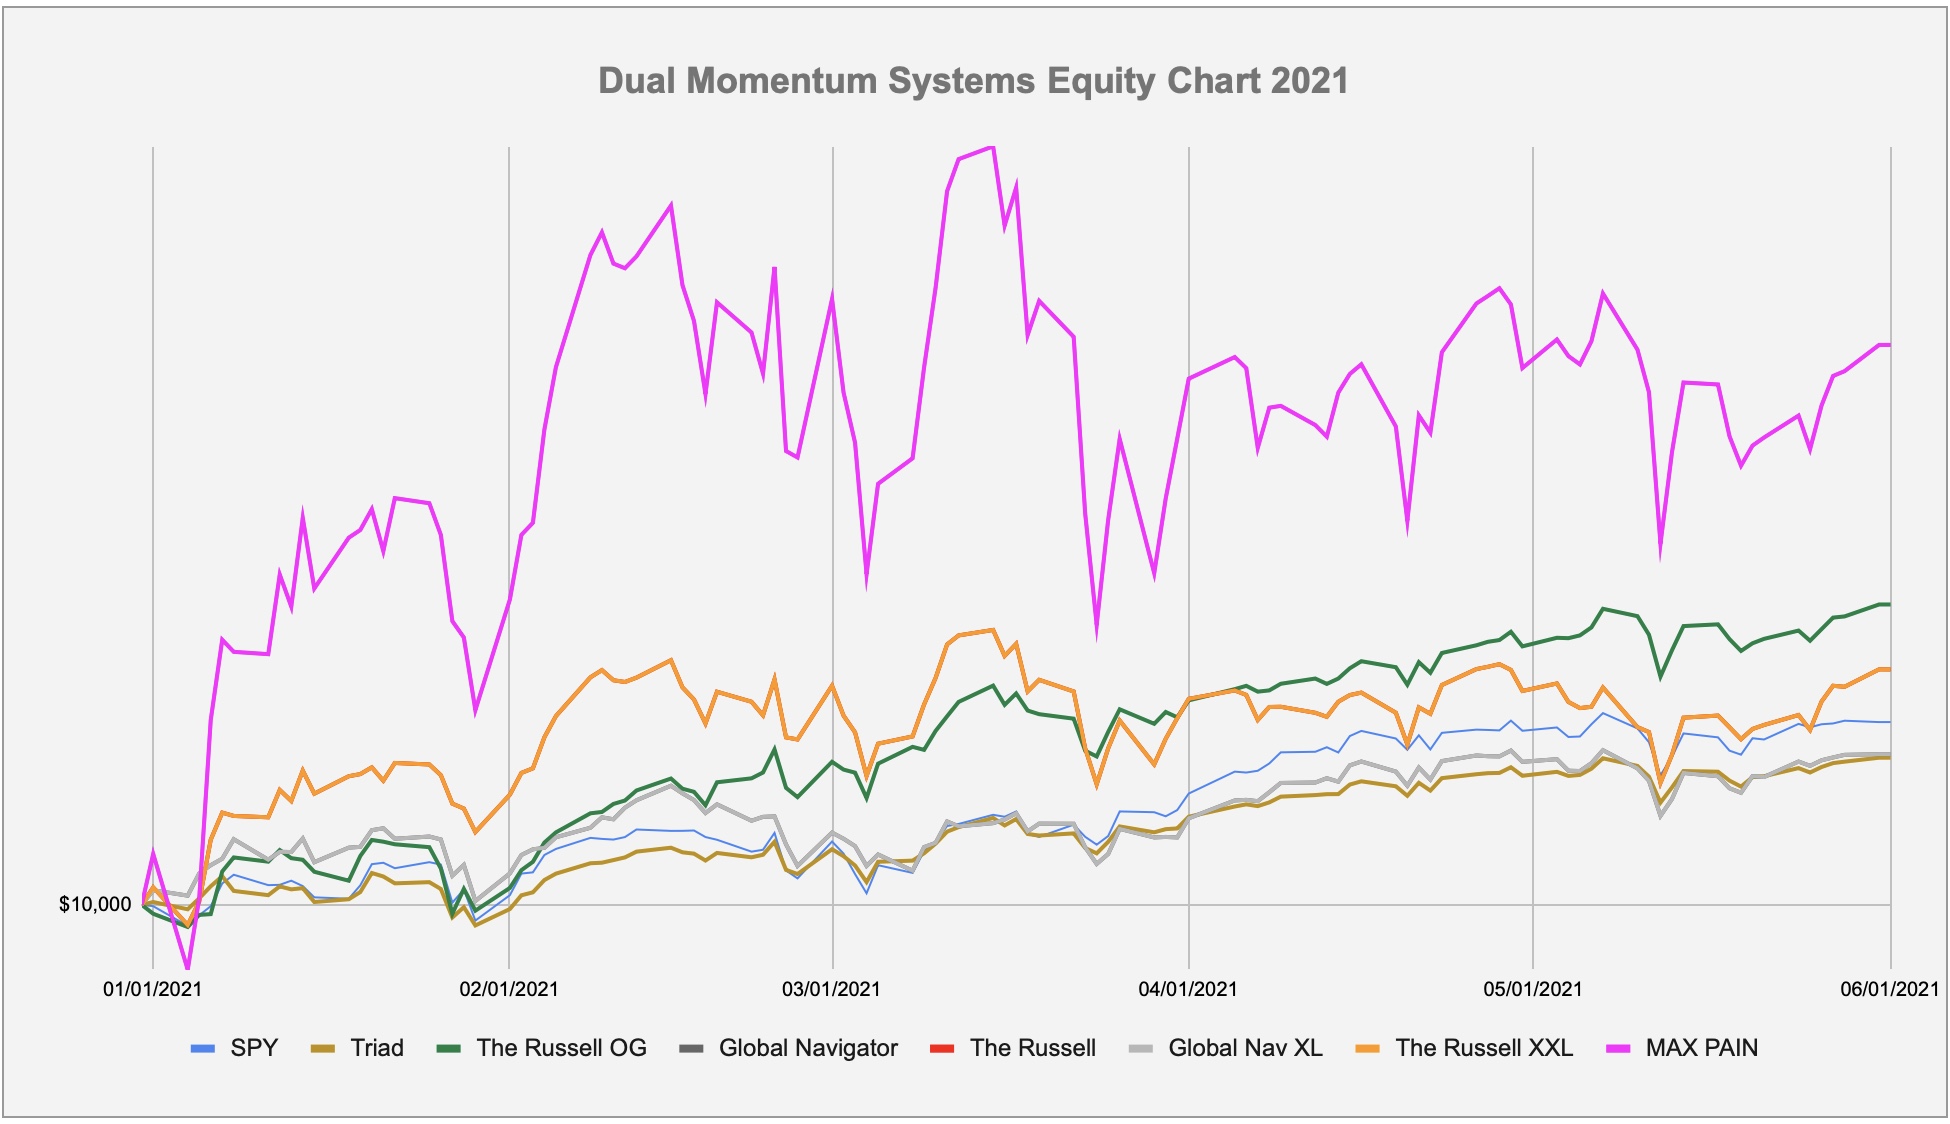
YTD Chart
The equity chart below is daily activity through June 1, 2021. Note that you don't see a red line for The Russell, it has had the same investment selections this year to date as The Russell XXL, the orangish line of The Russell XXL represents both it and The Russell so far this year. Additionally, the light gray line for Global Navigator XXL is covering the dark gray line of Global Navigator year to date.