S&P Monthly Results Histogram
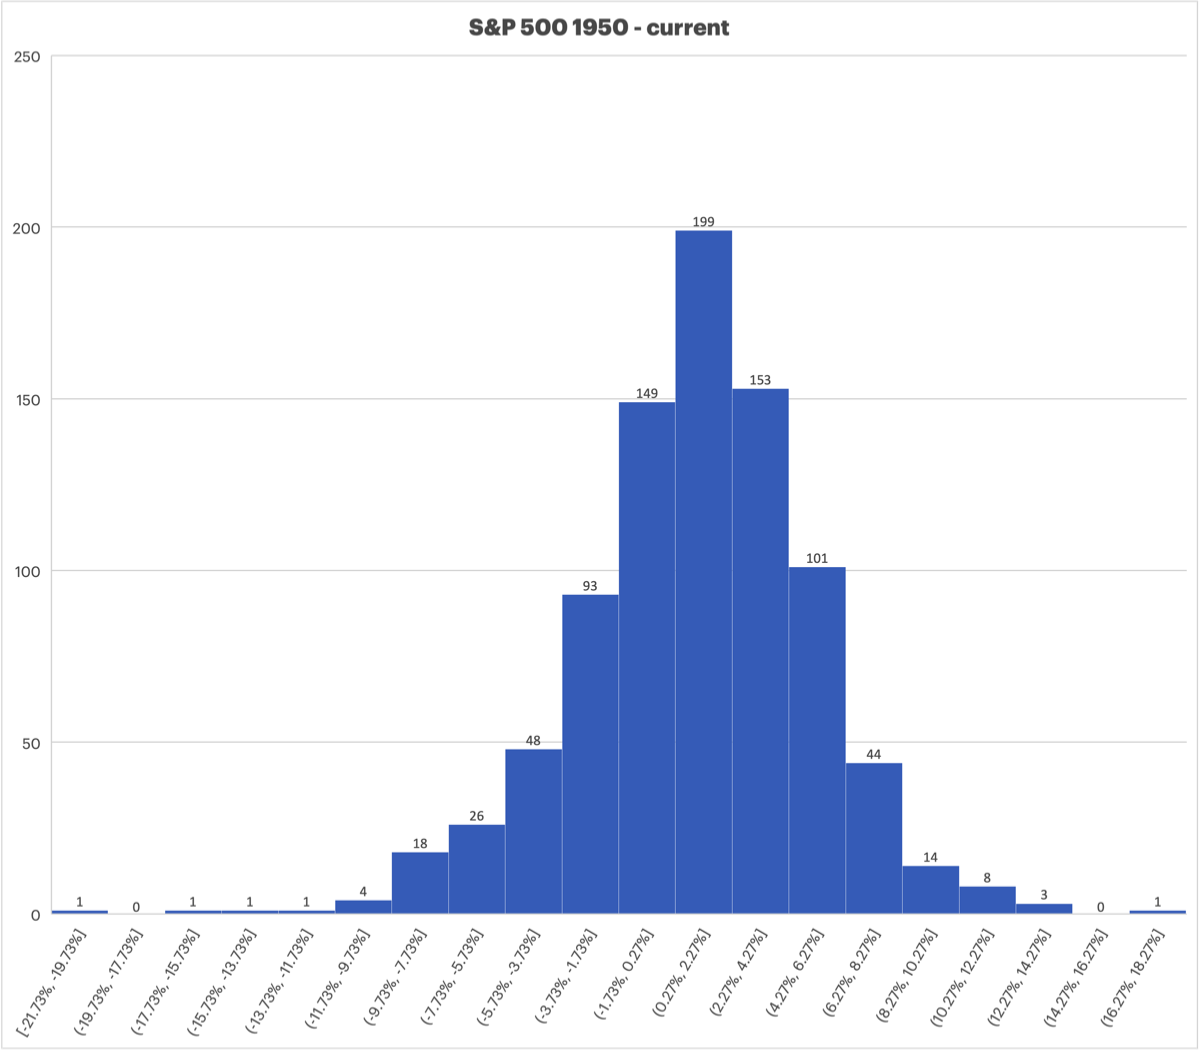
The S&P is currently down just more than 4% mid month January 2022, that got me curious how often "big" negative months occur in the S&P 500 so I created two histogram charts to show the frequency of historical monthly total returns.
Looking at the first histogram from 1950 through January MTD 2022, you can see that there were 48 months with returns between -3.73% and -5.73%, out of a total of 865 months. If we look at this column and all of the ones to the left, there are a total of 48+26+18+4+1+1+1+1=100 months. 100/865=11.6% of months have had returns of -3.73% or worse.
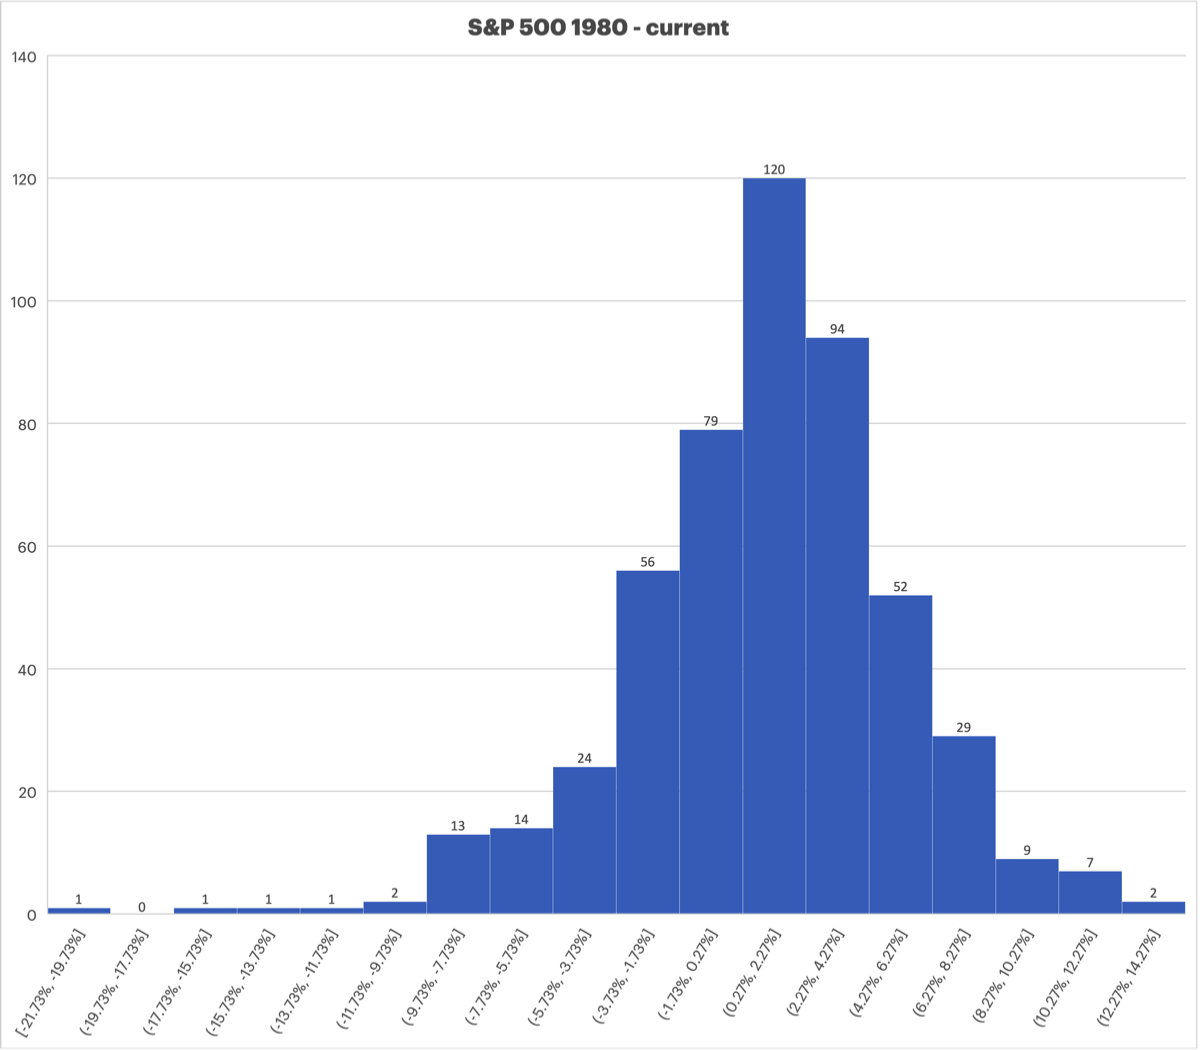
When looking at the 1980 through January MTD 2022 we get almost identical results, 11.3% of months had returns of -3.73% or worse.
Roughly speaking, this size monthly negative return happens around 1 in every 10 months. January isn't finished and we don't know where it will end up - this was an exercise to see how often large negative months occur.
Looking at the first histogram from 1950 through January MTD 2022, you can see that there were 48 months with returns between -3.73% and -5.73%, out of a total of 865 months. If we look at this column and all of the ones to the left, there are a total of 48+26+18+4+1+1+1+1=100 months. 100/865=11.6% of months have had returns of -3.73% or worse.
When looking at the 1980 through January MTD 2022 we get almost identical results, 11.3% of months had returns of -3.73% or worse.
Roughly speaking, this size monthly negative return happens around 1 in every 10 months. January isn't finished and we don't know where it will end up - this was an exercise to see how often large negative months occur.