How do monthly TAA strategies compare to Allocation portfolios?
It is easy to see why people like allocations that are rebalanced annual. Whether you invest in a 60/40 allocation, All Weather, Permanent Portfolio, Golden Butterfly or others - the appeal is near market returns over time without the highs and lows. We prefer technical asset allocation which generally may have a change of investment at the end of any given month. Are we rewarded for the more 'fiddling' with our investments than those who invest in an allocation that is only rebalanced annually? Let's take a look.
I ran results on PortfolioVisualizer for Golden Butterfly, 60/40, and Permanent Portfolio, results here. From 1992, as far back as I could get the results, through Jan 2022, Golden Butterfly has the best combination of returns and maximum drawdown. Because Golden Butterfly took the Gold out of these three, I will compare it to the DMS strategies which never use any leverage, that is Triad and The Russell OG. These two DMS strategies may have a change of investment at the end of every month, Golden Butterfly is a buy and hold that is rebalanced annually. How do they compare?
I ran results on PortfolioVisualizer for Golden Butterfly, 60/40, and Permanent Portfolio, results here. From 1992, as far back as I could get the results, through Jan 2022, Golden Butterfly has the best combination of returns and maximum drawdown. Because Golden Butterfly took the Gold out of these three, I will compare it to the DMS strategies which never use any leverage, that is Triad and The Russell OG. These two DMS strategies may have a change of investment at the end of every month, Golden Butterfly is a buy and hold that is rebalanced annually. How do they compare?
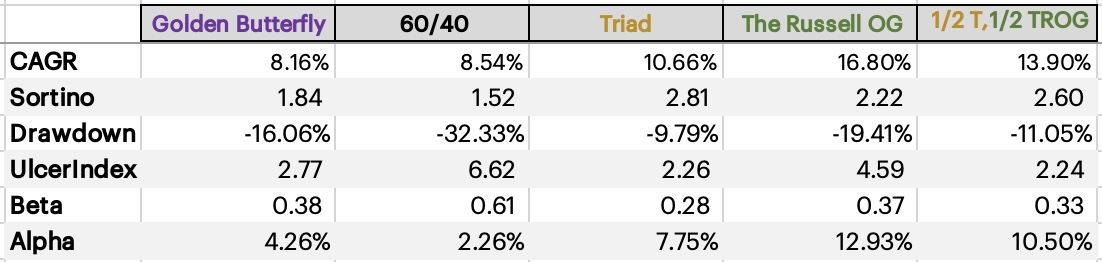
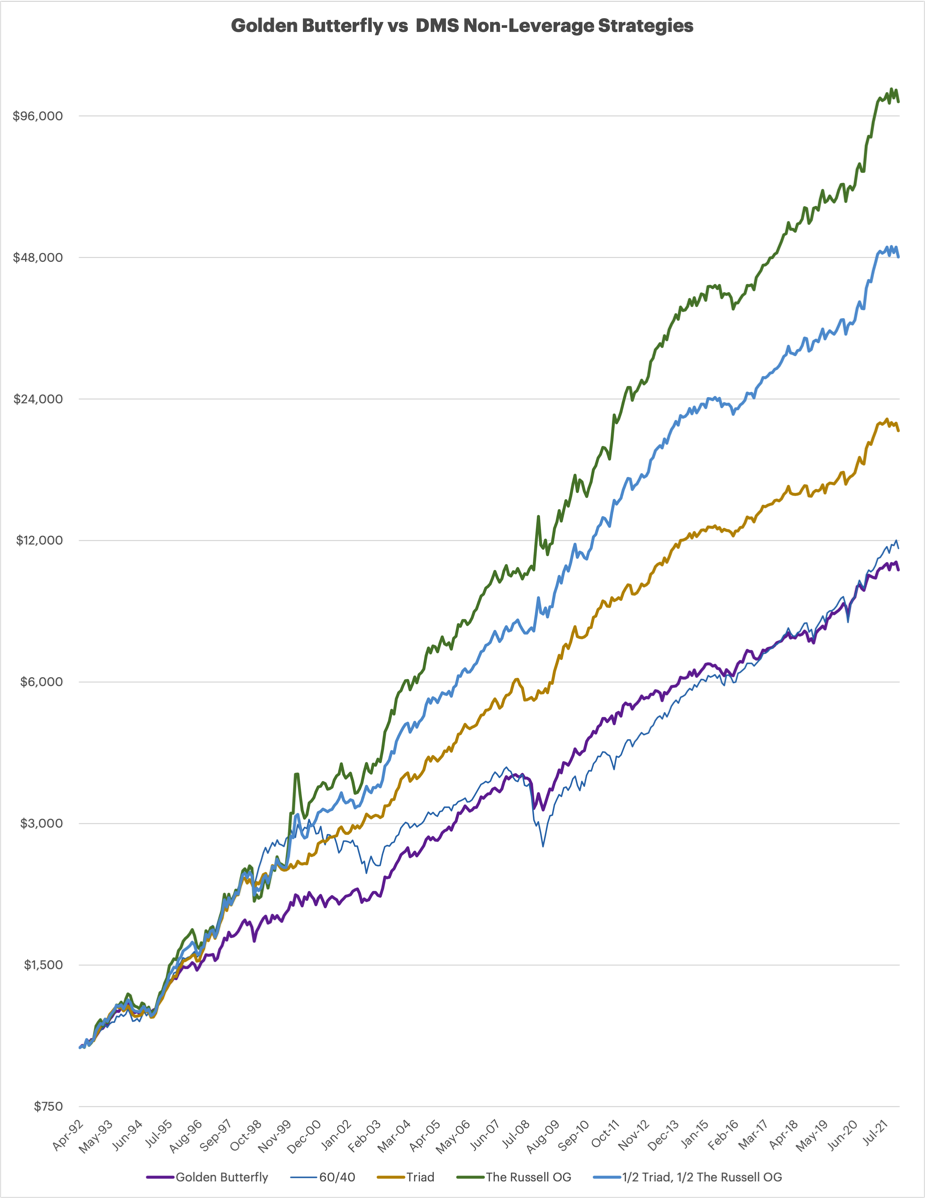
What a staggering difference in returns from May 1992 through January 2022. Both Triad and The Russell OG produce superior returns, and I also show a ½ Triad and ½ The Russell OG. For both DMS Strategies and the combination, the CAGR is higher, Sortino is higher, Drawdown for Triad is significantly lower, and only a bit higher for The Russell OG, Ulcer Index is lower for Triad and a noticeably higher for The Russell OG, Beta's are all similar, Alpha much higher for DMS. The stats on the Combo are pretty awesome.
While the convenience of a buy and hold strategies that is rebalanced every year sounds appealing, the superior results of these two never-leveraged strategies seems worth an extra few minutes per month to make any necessary trades.
While the convenience of a buy and hold strategies that is rebalanced every year sounds appealing, the superior results of these two never-leveraged strategies seems worth an extra few minutes per month to make any necessary trades.