
Permanent Portfolio vs Triad
Muhammed Ali towering victoriously over a beaten Sonny Liston, if the Triad strategy could feel victorious for crushing the Permanent Portfolio, I imagine this is how it would feel.
I recently highlighted the new Triad strategy and detailed how it works, here. Investing in Triad since coming up with this strategy has made me realize that I find the potential Gold allocation to be too large, a 1/3rd position in Gold is more volatile than Triad was designed to be, and I have modified Triad going forward. Up to 1/3rd of the strategy will go into IWB, the Russell 1000, and up to 1/3rd will go into IWS, the Russell Mid-Cap Value, and up to 1/6th of the strategy will be allocated to SGOL, Aberdeen Standard Physical Swiss Gold Shares; this means that there will always be a minimum of 1/6th allocation to the best performer of VGIT, VCSH, or VGSH, Intermediate Treasuries, Short Term Corporate Bonds, or Short Term Treasuries. This reduction of the allocation to Gold only slightly reduces the long term CAGR, but reduces the Ulcer Index appreciably, as was the goal.
First a quick primer, why was Triad created - what was the goal? This is a conservative strategy that uses no leverage, aims to have a low ulcer index with great returns over a full investing cycle including good and bad years, it will underperform in the good years, however, it will outperform in the bad years.
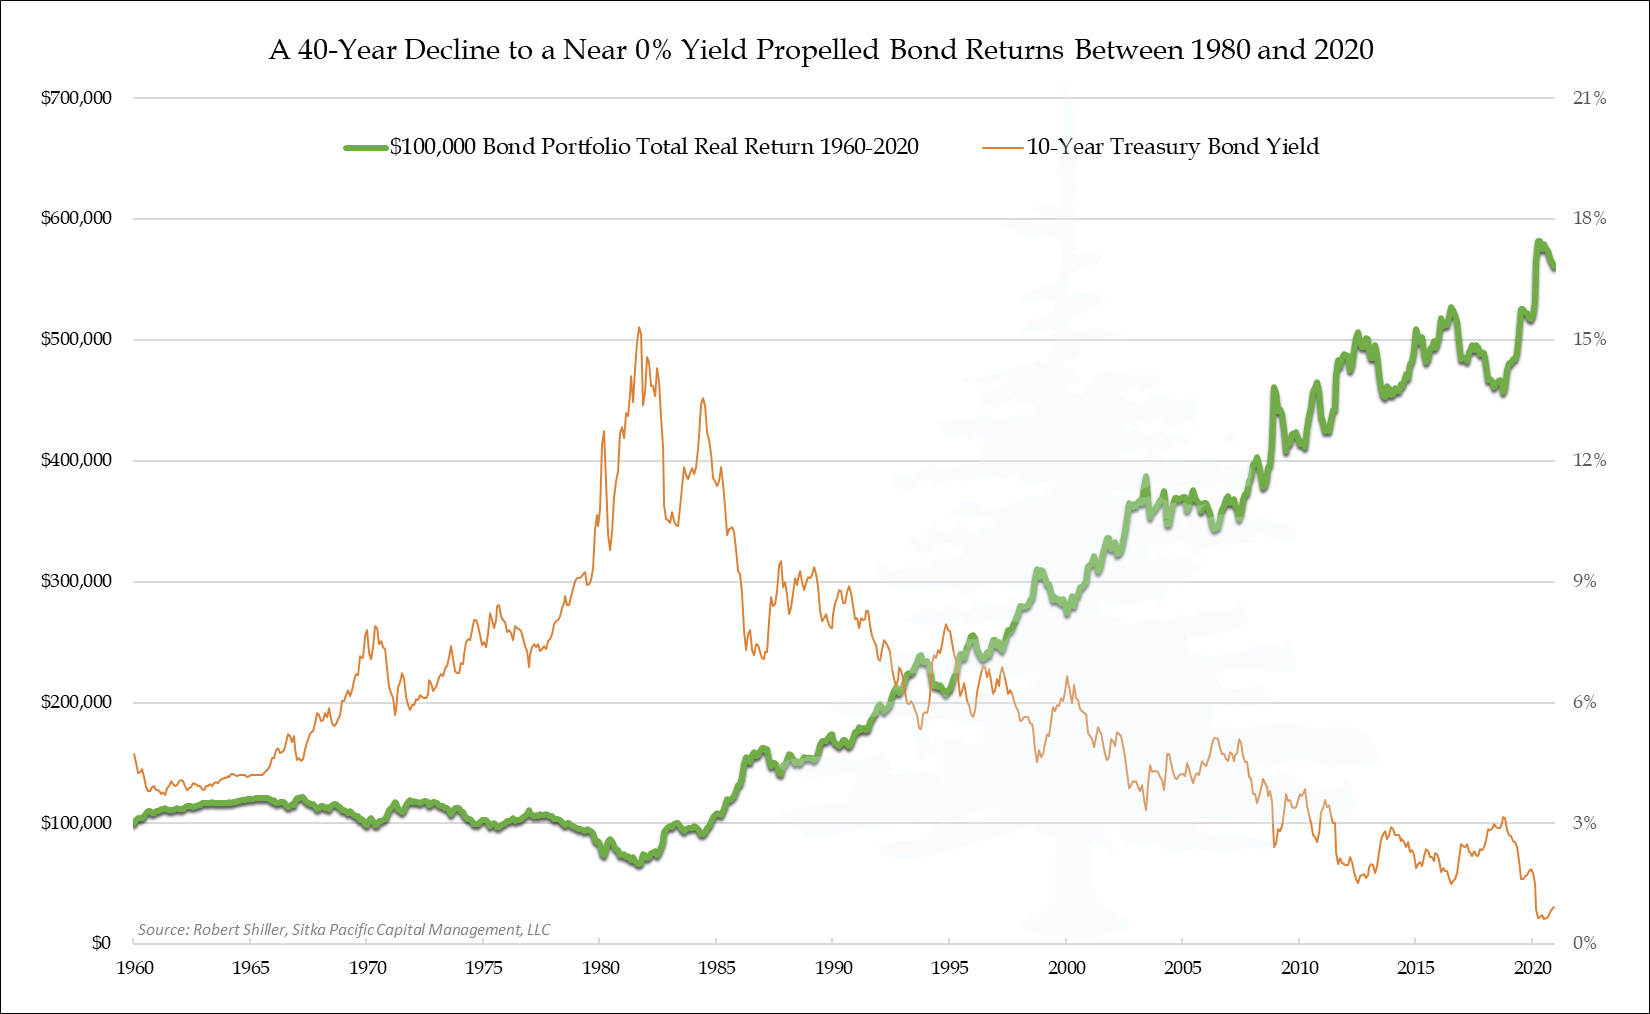
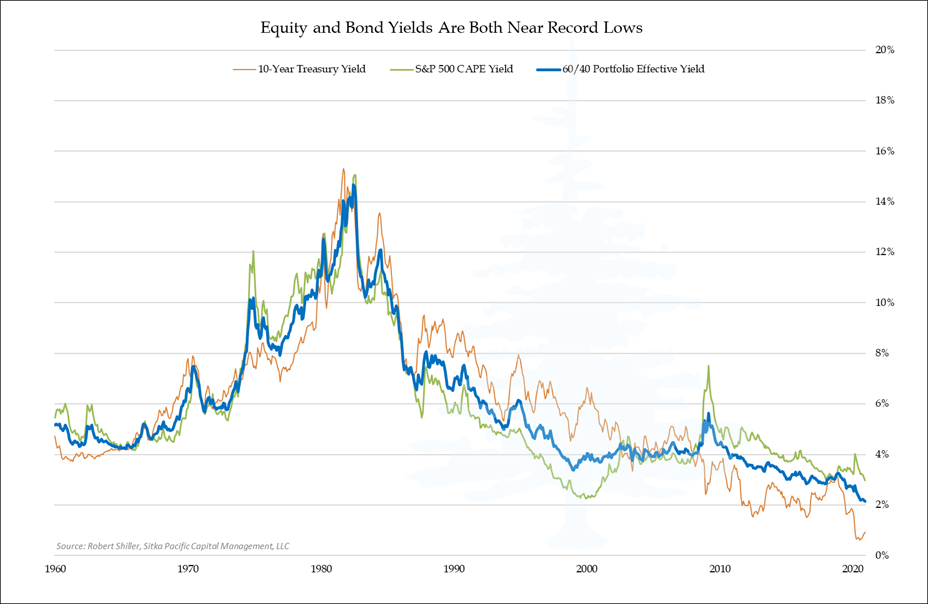
The two charts below show why a 60/40 (or a 70/30, or an 80/20) will suffer going forward, Bonds have already given what they can, there isn't much left in that allocation.
I was recently asked if I could compare Triad to Harry Browne's Permanent Portfolio, I was curious myself how they would compare, so here is the crushing story.
The data below was compiled with results through September 22, 2021. The results go back to May 1992, not a date I picked, but rather because that is how far back Portfolio Visualizer had results.
Permanent Portfolio is 25%/25%/25%/25% into Stocks/Gold/Long Term Treasuries/Cash
For this exercise I gave Permanent Portfolio the benefit of the doubt and instead of actual "cash" I went with Short Term Treasuries which provided more return. The allocation and funds used are: VTSMX / ^GOLD / VUSTX / VFISX
The Portfolio Visualizer link to the data is here.
For the comparison, I did Permanent Portfolio vs Total US Market vs Triad from May 1992 through current, and then the same comparison for what I refer to as the modern era, 2000 forward.
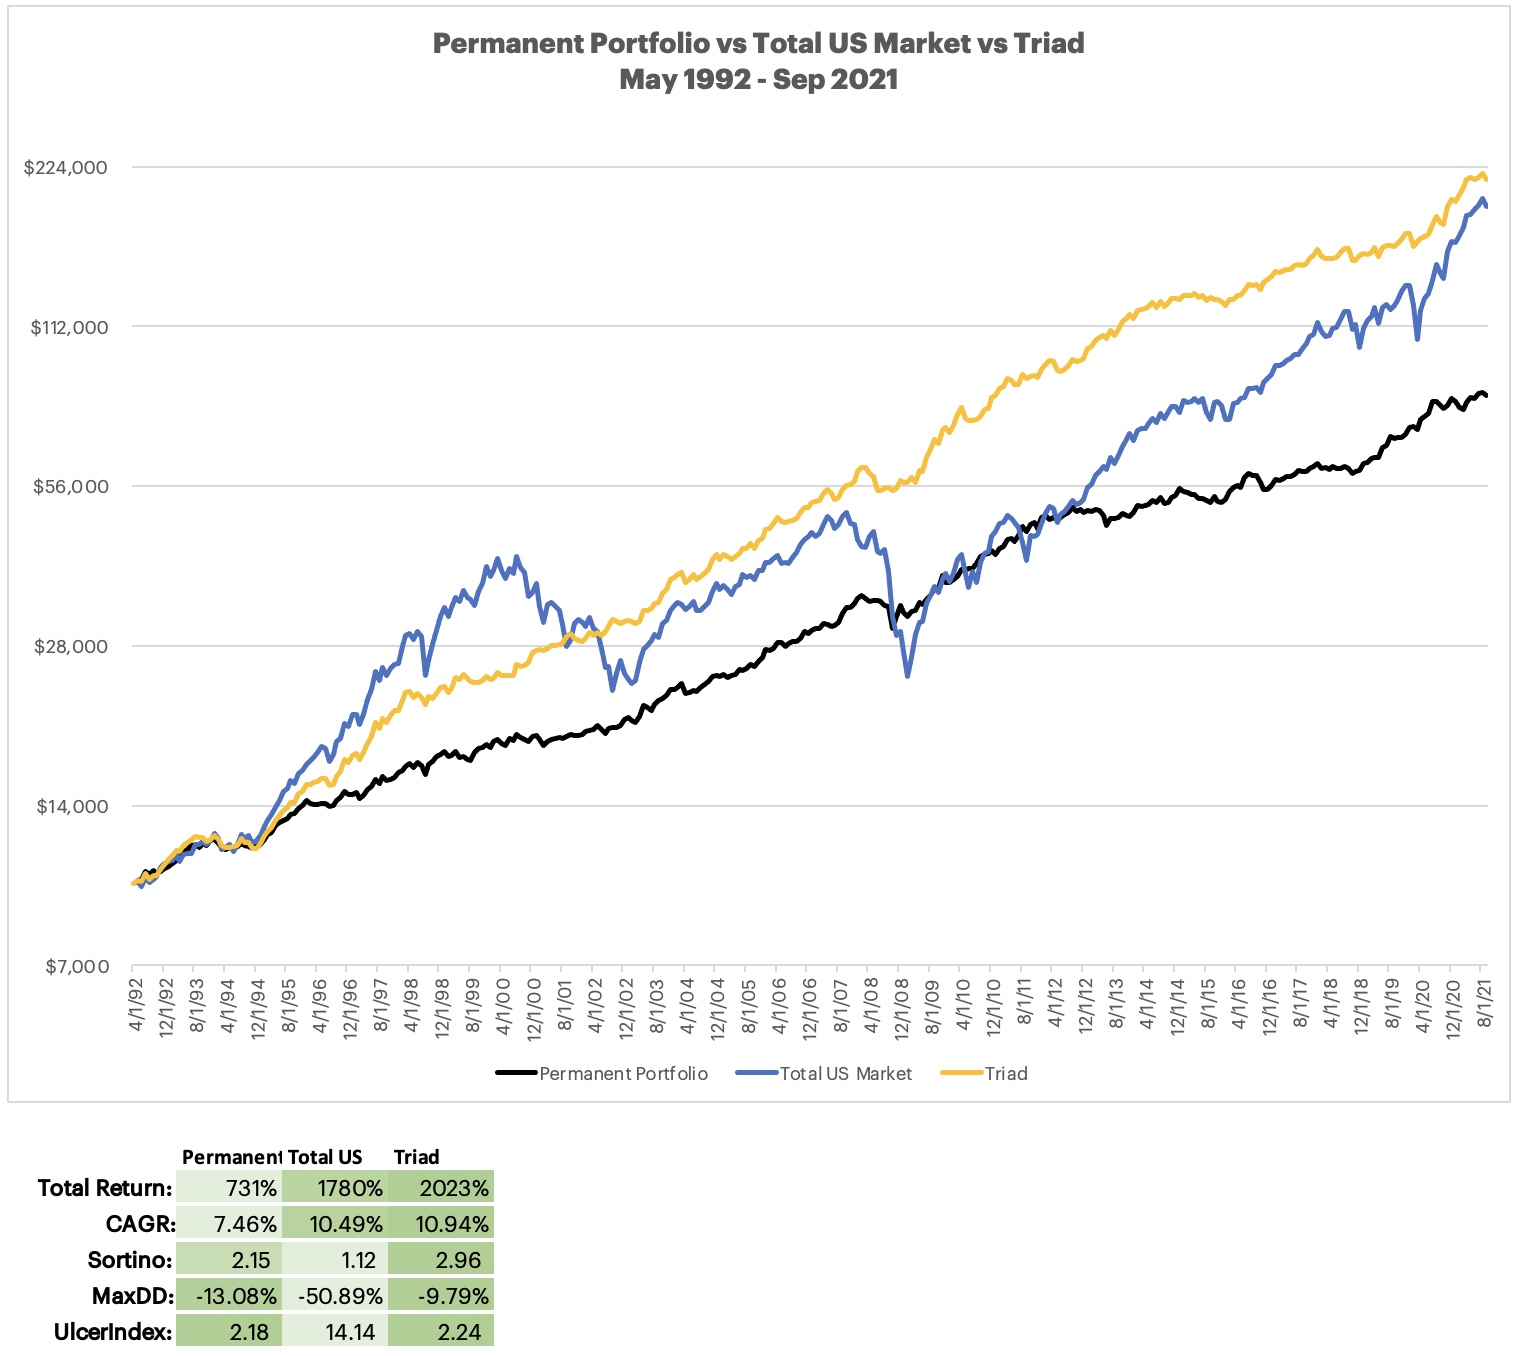
The results from mid-1992 forward show Triad returning over 2.75X the return that the Permanent Portfolio returned, in fact it bested the Total US Market by a noticeable margin as well.
Not only are the results superior to PP, but the Maximum Drawdown was also less, and all with a virtually identical Ulcer Index. So on a risk adjusted return basis, Permanent Portfolio was absolutely crushed by Triad over this time period, as was the Total US Market.
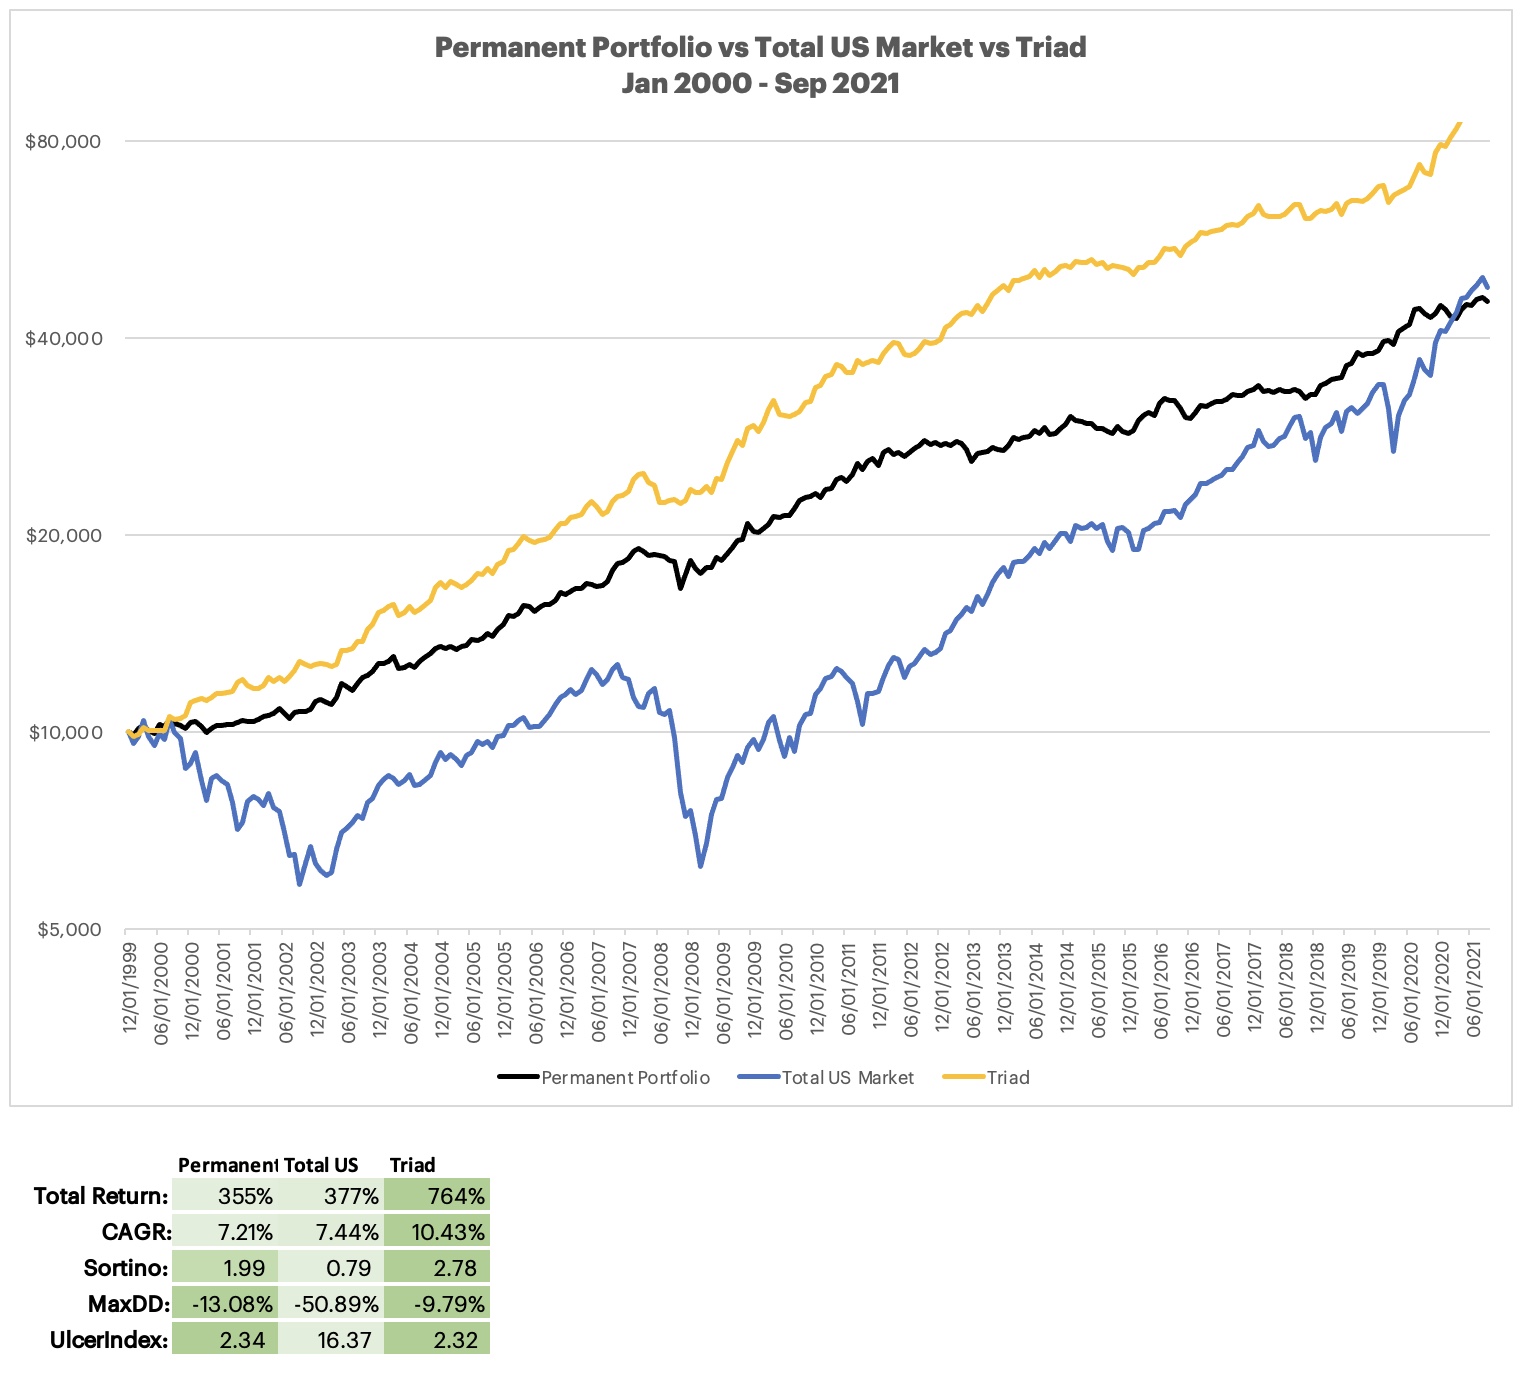
2000 to current is shown in this second chart. Similar results to the full time period. Triad delivers superior results, as with the full time period in this time period it also has a slightly better Maximum Drawdown than Permanent Portfolio, and a virtually identical Ulcer Index and with over double the total returns. Triad on a risk adjusted basis is towering over the bloody Permanent Portfolio which is broken and lying on the floor.
Enjoy the strategies, feel free to ask questions.
Happy Investing, please be strategic and thoughtful by using Dual Momentum Systems.
Sign up for monthly investment updates here.