How much leverage is the right amount?

It is common for people to use leverage, whether in the form of leveraged ETF's, margin, or futures as a way of enhancing returns when things are going well in the markets. The problem is that leverage cuts both ways, it can dramatically increase your gains, and it can also dramatically increase your drawdowns.
It is not only retail investors getting 'greedy' using leverage either, did you know that not only do Hedge Funds use a lot of leverage, but even Berkshire Hathaway is usually using leverage? I didn't dig into it, but it appears that they often use 1.2x to 2.0x leverage, and they are generally considered to be conservative. You may recall how Long Term Capital Management blew up from using too much leverage, when things went against them.
Having looked at the risk adjusted returns for holding leveraged ETF's for long periods of time, it is shocking how much volatility and drawdowns they can incur. But Fear Of Missing Out, FOMO, still taunts people to try and enhance returns.
I got more aggressive in 2021, not long before the market rolled over and got stung as a result. Not a mortal wound, but a good lesson to not leverage up too much. The truth is, I was leveraged more than I was comfortable with, but it didn't rear it's ugly head until things turned downward.
Many of the DMS strategies take advantage of Smart Leverage, which is designed to only leverage up when the odds are in our favor for doing well, however, this doesn't mean that being 100% invested in LT Gain++ is a terrific idea because there will be times when you are 300% leveraged. Certainly some people can handle that volatility, not me!
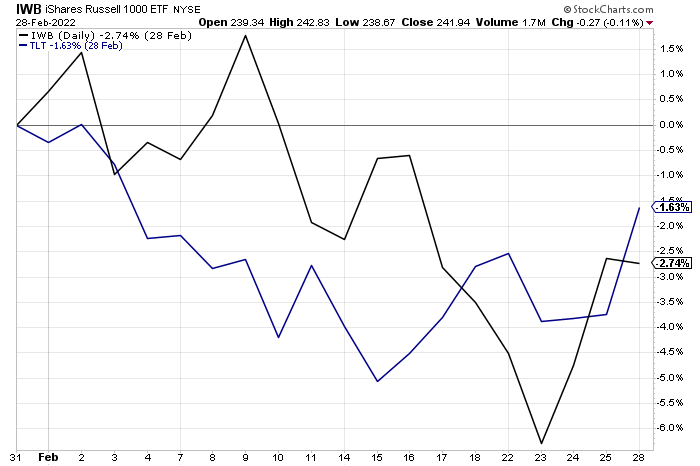
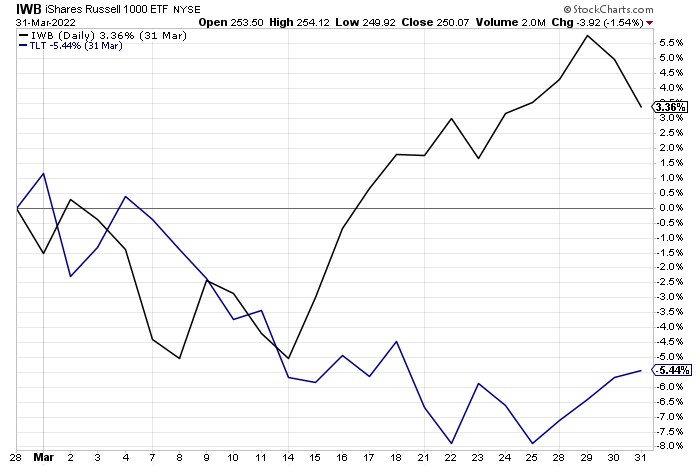
With less than a week to go before June has completed, it looks like we may trigger Smart Leverage this month. As a reminder, Smart Leverage looks at drawdowns in IWB from the month end high water mark to the current month end results, when this reflects a drawdown of 15% or greater, Smart Leverage is triggered, and when we go back into equities we do so with leverage. The "+" strategies use 2X, SSO, the "++" strategies use 3X, UPRO.
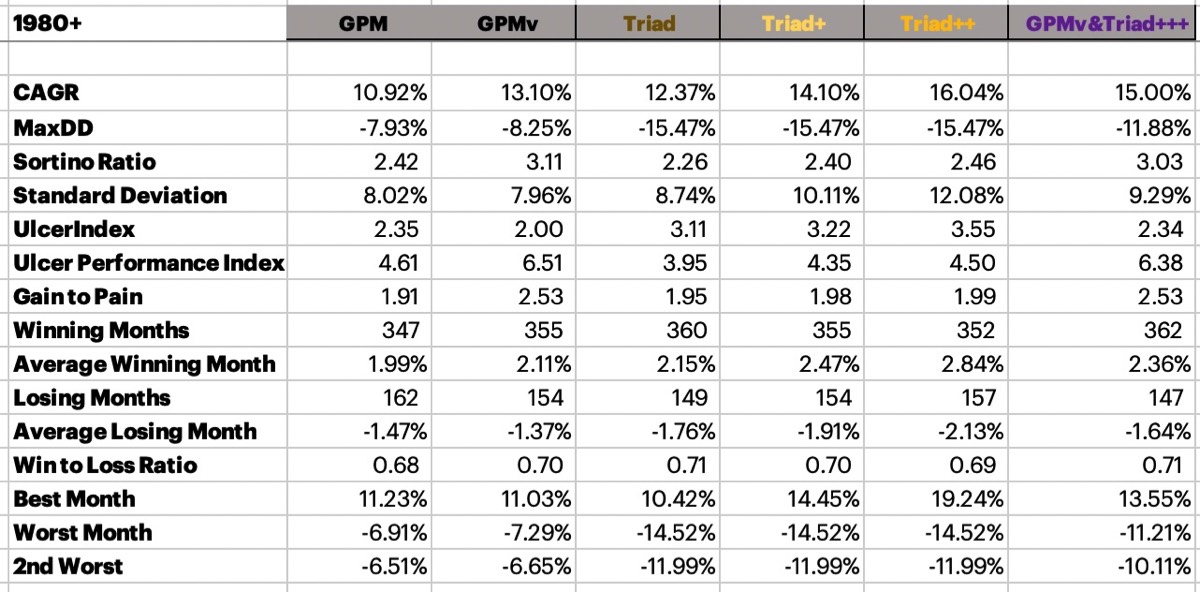
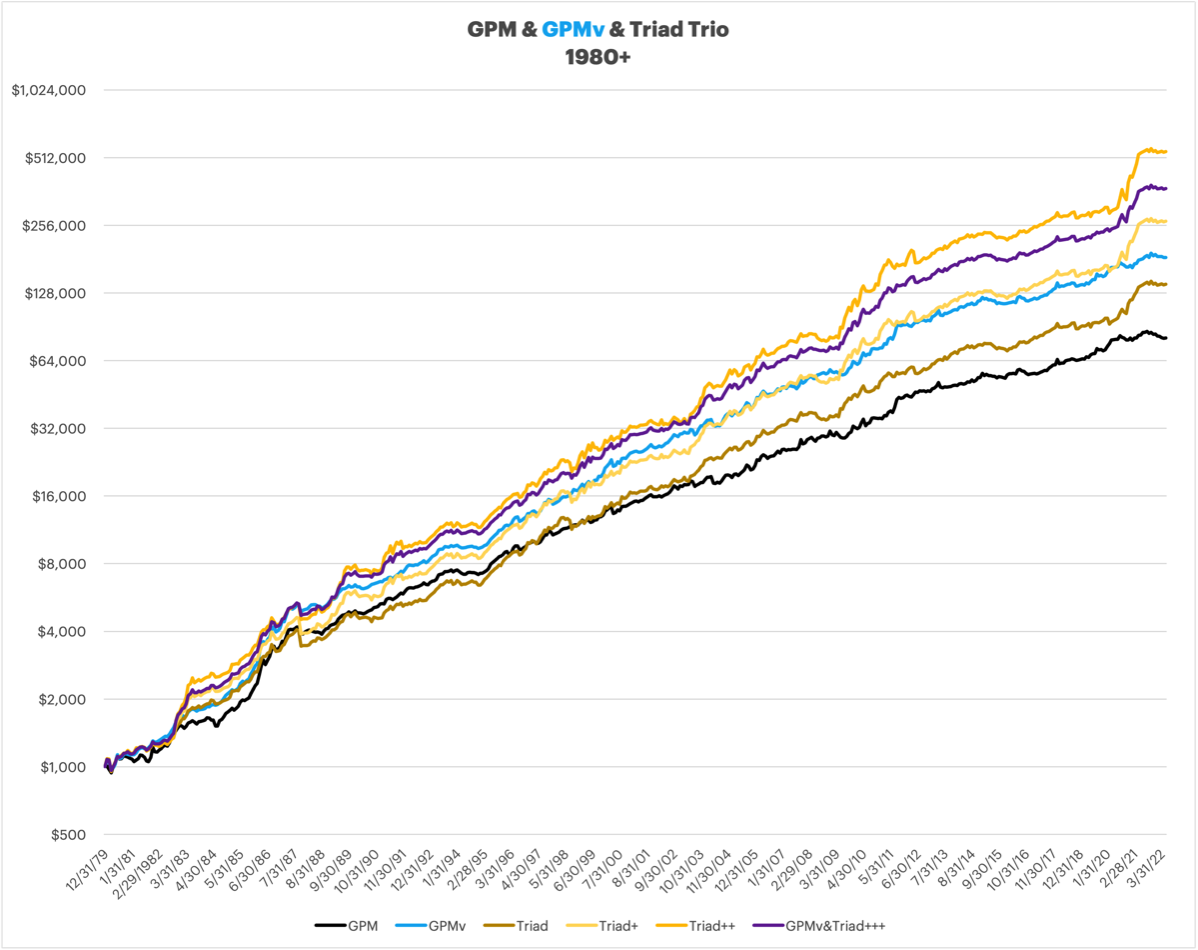
Triad only has a maximum allocation of 1/3rd to IWB, the Russell 1000. So even if you are in Triad++, the maximum leveraged position you have to the market is 100% for the IWB portion (1/3 x 3X), and it could still have 1/3rd in either Russell Mid-Cap Value, or Foreign, and also up to 1/6th position in either Gold or Commodities. This is an amount of leverage that I am personally good with. At this point in my life, I don't want the volatility or risks that come from being overly leveraged and my recent fall from grace was an excellent reminder of this. If you don't learn from your mistakes, you are likely to repeat them.
If you are investing in the DMS strategies, please consider the leverage you will be taking when we go back into equities if/when Smart Leverage is triggered. It would not be out of the question whatsoever to see a 20% loss in a month for the overall market, and if you are 100% in 3X leveraged strategies, that would equate to near a 60% loss for the month. That would be a significantly huge loss in the span of one month. Caution is advised. Consider your allocation, and not just how you will do if things work out as we hope, but please also consider the downside possibility and what that would mean for your portfolio.
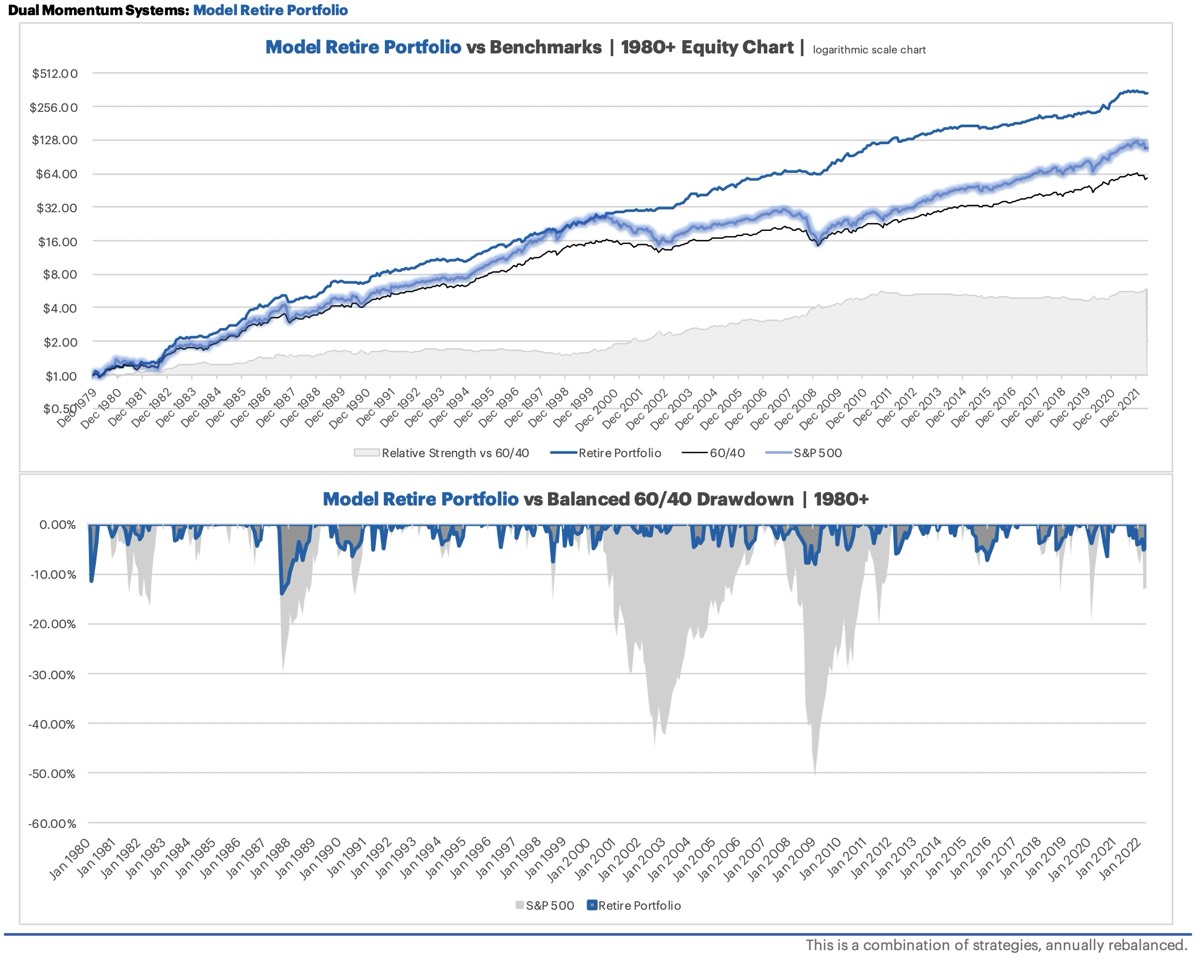
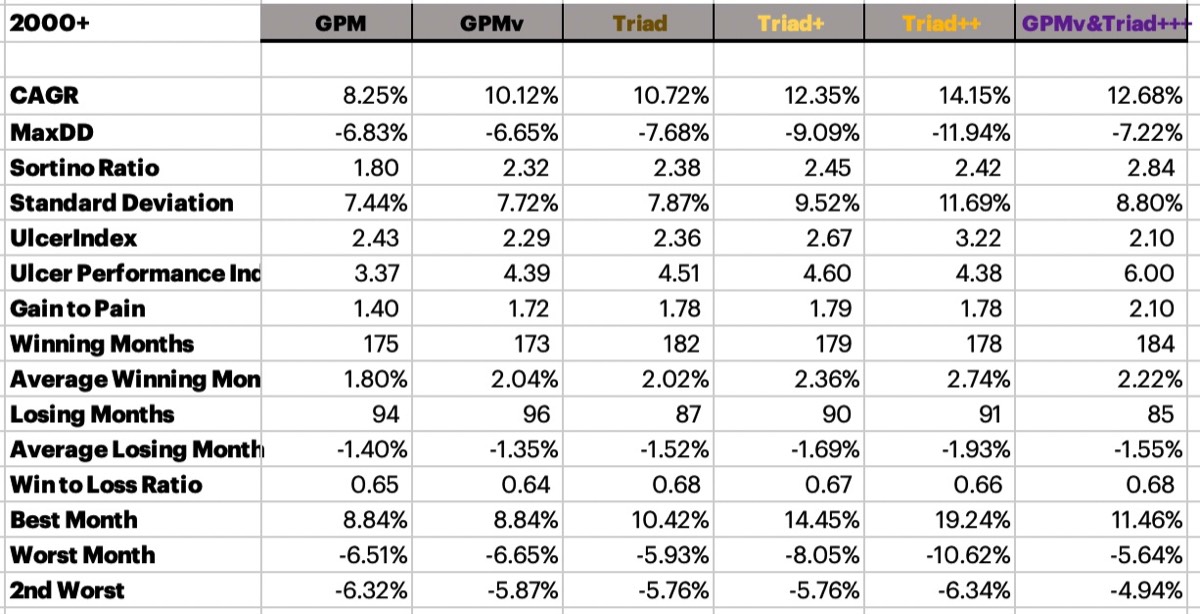
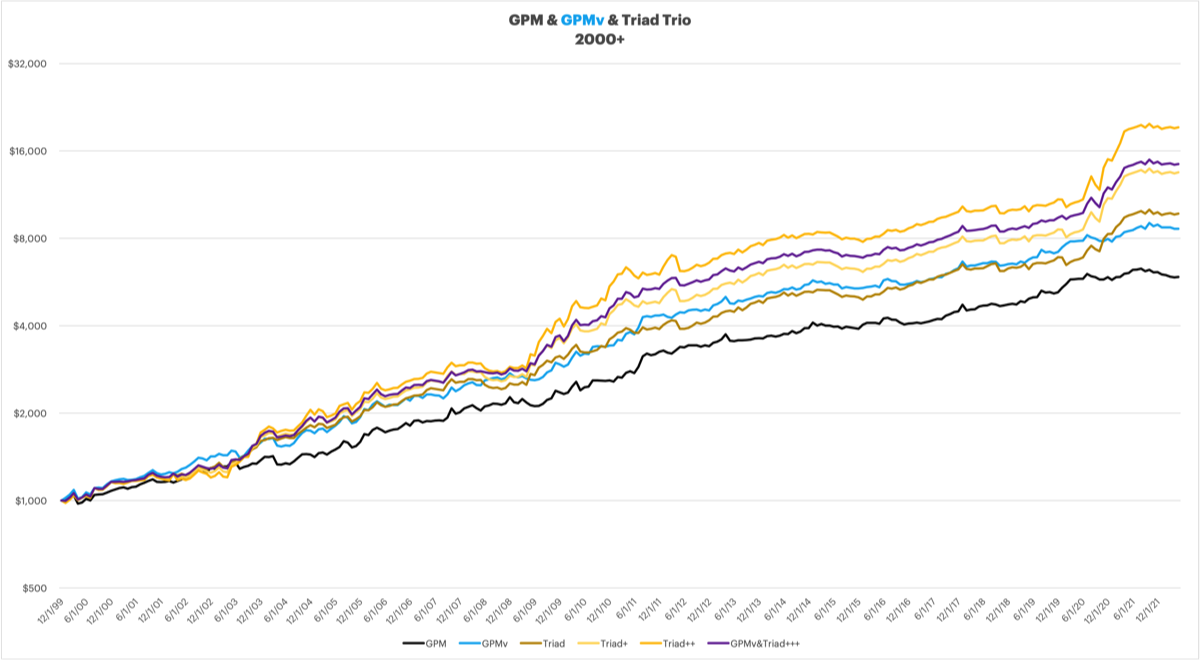
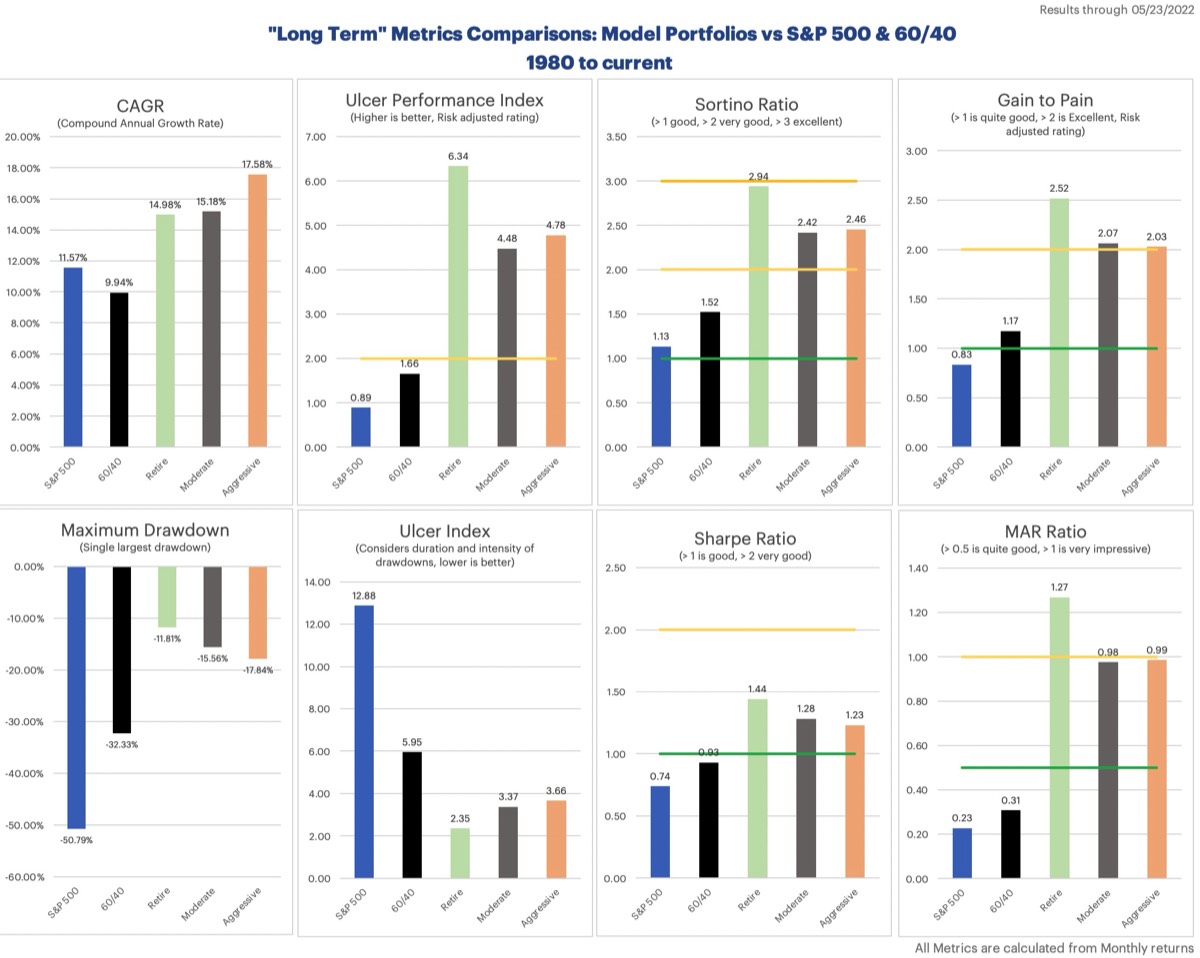
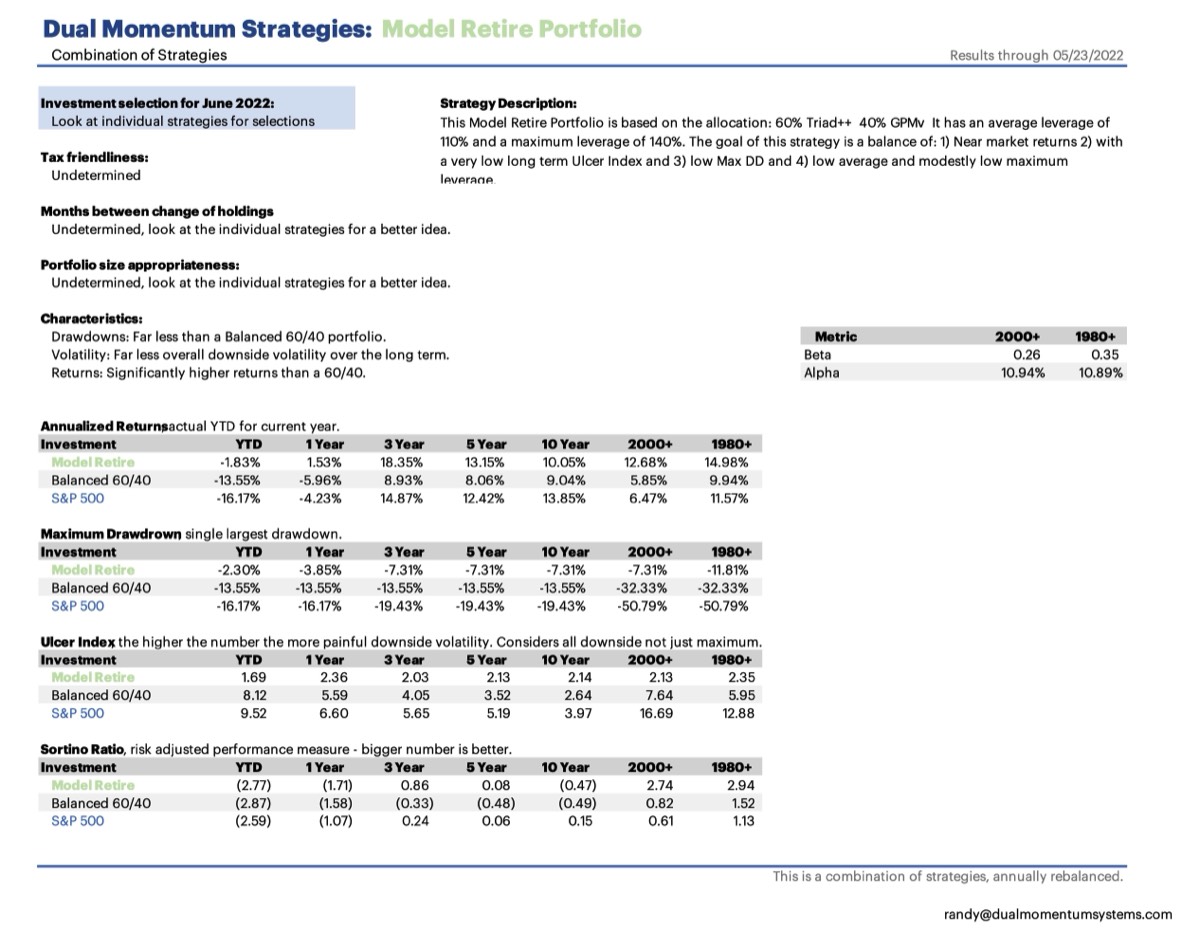
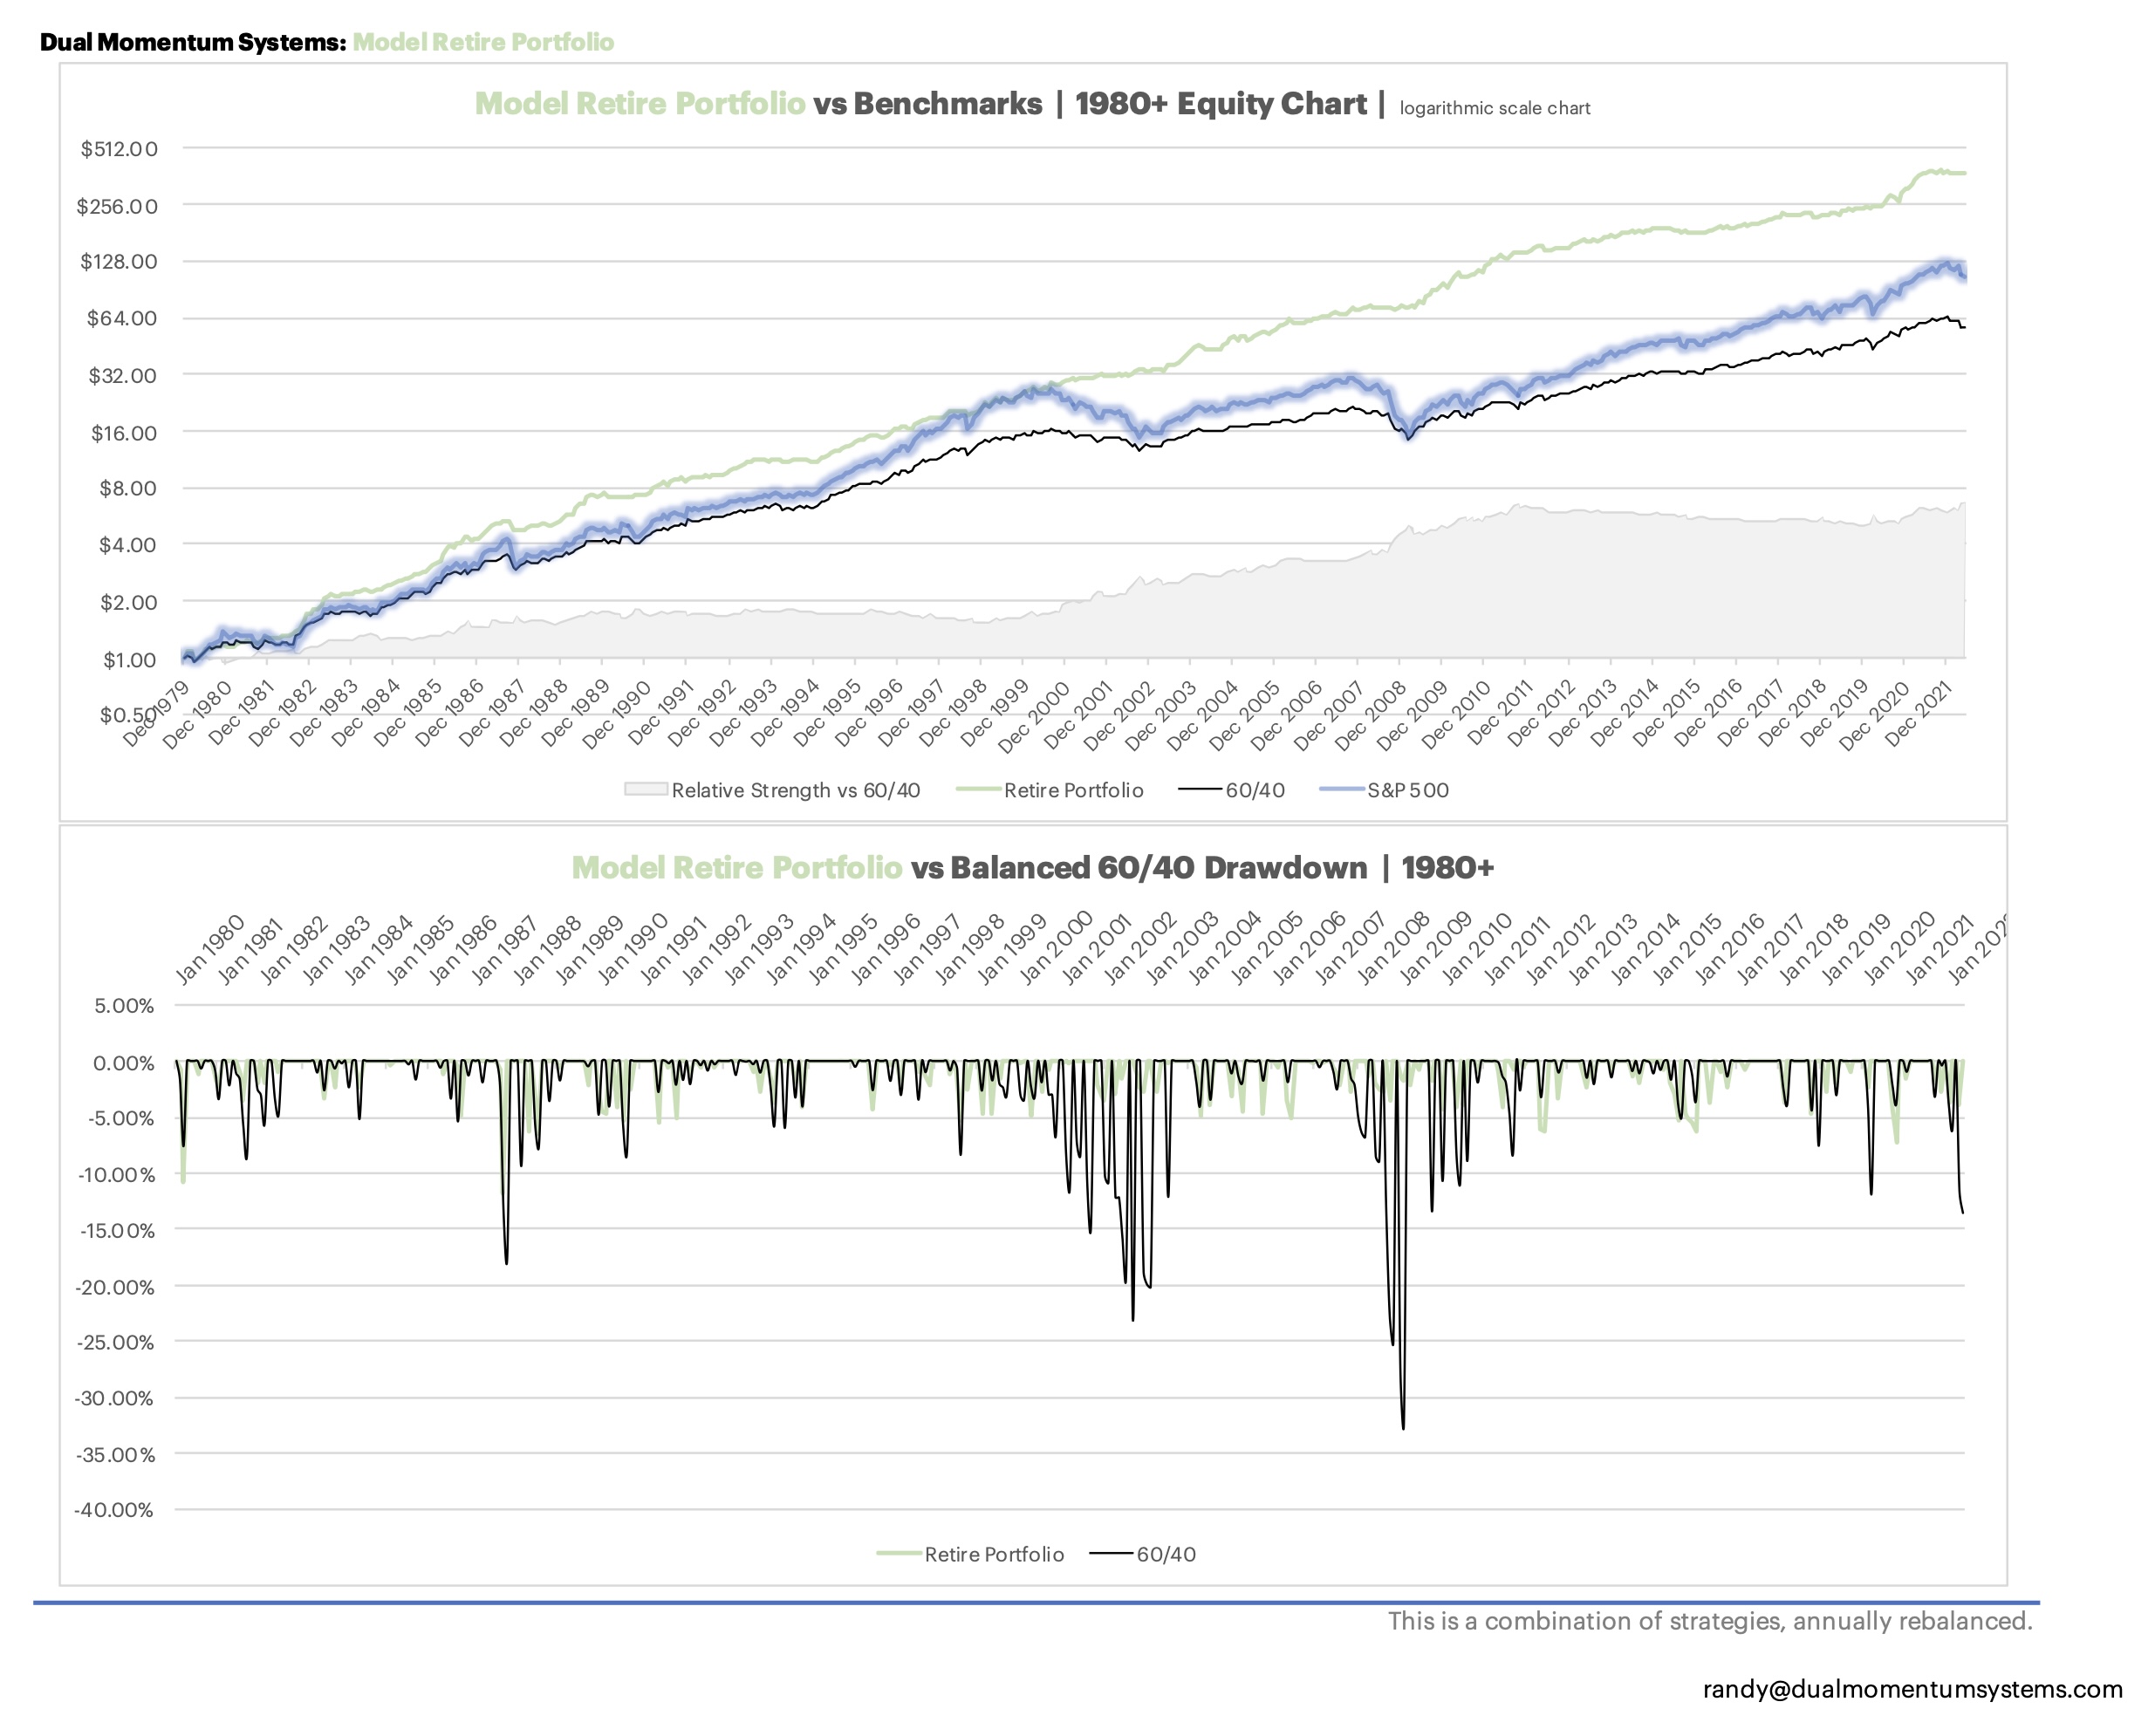
My personal allocation is similar to the Model Portfolio Retirement allocation as shown recently in the Reporting Decks. Which is 35% GPMv, 50% Triad++, and 15% IWR (Russell Mid-Cap). As shown in the reporting deck, this allocation has a backtested history of terrific returns that are above market performance, with far less volatility and drawdowns. Seems like a great path for me to follow. Note that I do have my kids more aggressively allocated, but not too much maximum leverage. The Reporting Decks show both the Maximum and Average Leverage for each strategy and Model Portfolio. While the Average Leverage is important to note, it is the Maximum Leverage that one needs to pay the most attention to.
It is not only retail investors getting 'greedy' using leverage either, did you know that not only do Hedge Funds use a lot of leverage, but even Berkshire Hathaway is usually using leverage? I didn't dig into it, but it appears that they often use 1.2x to 2.0x leverage, and they are generally considered to be conservative. You may recall how Long Term Capital Management blew up from using too much leverage, when things went against them.
Having looked at the risk adjusted returns for holding leveraged ETF's for long periods of time, it is shocking how much volatility and drawdowns they can incur. But Fear Of Missing Out, FOMO, still taunts people to try and enhance returns.
I got more aggressive in 2021, not long before the market rolled over and got stung as a result. Not a mortal wound, but a good lesson to not leverage up too much. The truth is, I was leveraged more than I was comfortable with, but it didn't rear it's ugly head until things turned downward.
Many of the DMS strategies take advantage of Smart Leverage, which is designed to only leverage up when the odds are in our favor for doing well, however, this doesn't mean that being 100% invested in LT Gain++ is a terrific idea because there will be times when you are 300% leveraged. Certainly some people can handle that volatility, not me!
With less than a week to go before June has completed, it looks like we may trigger Smart Leverage this month. As a reminder, Smart Leverage looks at drawdowns in IWB from the month end high water mark to the current month end results, when this reflects a drawdown of 15% or greater, Smart Leverage is triggered, and when we go back into equities we do so with leverage. The "+" strategies use 2X, SSO, the "++" strategies use 3X, UPRO.
Triad only has a maximum allocation of 1/3rd to IWB, the Russell 1000. So even if you are in Triad++, the maximum leveraged position you have to the market is 100% for the IWB portion (1/3 x 3X), and it could still have 1/3rd in either Russell Mid-Cap Value, or Foreign, and also up to 1/6th position in either Gold or Commodities. This is an amount of leverage that I am personally good with. At this point in my life, I don't want the volatility or risks that come from being overly leveraged and my recent fall from grace was an excellent reminder of this. If you don't learn from your mistakes, you are likely to repeat them.
If you are investing in the DMS strategies, please consider the leverage you will be taking when we go back into equities if/when Smart Leverage is triggered. It would not be out of the question whatsoever to see a 20% loss in a month for the overall market, and if you are 100% in 3X leveraged strategies, that would equate to near a 60% loss for the month. That would be a significantly huge loss in the span of one month. Caution is advised. Consider your allocation, and not just how you will do if things work out as we hope, but please also consider the downside possibility and what that would mean for your portfolio.
My personal allocation is similar to the Model Portfolio Retirement allocation as shown recently in the Reporting Decks. Which is 35% GPMv, 50% Triad++, and 15% IWR (Russell Mid-Cap). As shown in the reporting deck, this allocation has a backtested history of terrific returns that are above market performance, with far less volatility and drawdowns. Seems like a great path for me to follow. Note that I do have my kids more aggressively allocated, but not too much maximum leverage. The Reporting Decks show both the Maximum and Average Leverage for each strategy and Model Portfolio. While the Average Leverage is important to note, it is the Maximum Leverage that one needs to pay the most attention to.