GPMv is born

When I was scouring the internet, gaining interest in Tactical Asset Allocation strategies, TAA, I found myself on JW Keuning's website Index Swing Trader by his online name TrendXplorer. TrendXplorer and his co-hort in several strategies Wouter Keller have come up with some really interesting strategies. They iterated Protective Asset Allocation, PAA, to become Generalized Protective Momentum, GPM. The goal as TrendXplorer told me was extremely low drawdown, low drawdowns were given higher priority over returns. When I first ran across GPM, honestly I thought it was rather unique and brilliant how they used the correlations and used the positive count to scale into and out of the Risk On universe and the Safety assets. However, I also thought - BORING.

Some times, boring is good, in fact boring can be great. It took me a few years to come around to it, but I recently found myself investigating retirement portfolios for myself, not for today - but not too far off in the future. It was during this investigation that I found myself looking at GPM once again, and viewing it in a different light.

When people are accumulating assets, it is often the case that more risk and less diversity is taken. This can work well for capital growth, albeit likely accompanied with higher volatility. In retirement though, steady eddy is the goal. The lower the volatility the more reliable a portfolio is for drawing money in retirement without too large drawdowns. It is why allocation strategies like Golden Butterfly, Permanent Portfolio, and All Weather each far outperform the general market in retirement, they are far less volatile than the overall market and this keeps drawdowns from getting too large.

If you are familiar with this Dual Momentum Systems website, you likely know that my Global Navigator+ strategy is largely a derivative of Gary Antonacci's GEM strategy. I have a faster acting weighted lookback, and have implemented Smart Leverage for greater growth opportunities and Treasury Duration Limiter for safer Risk Off, but in a general sense you can see the resemblance. The Russell is a bit more varied from GEM. The LT Gain strategies, like Global Navigator+ you can see have inspiration from GEM, again with my take on them with the Single Momentum, the lookback, Smart Leverage, and Treasury Duration Limiter. The Triad Strategies are I would like to think wholly my own, there may be resemblance to other strategies, but I really came up with them without any inspiration of other strategies. I mention the strategies only to say that when I re-visted GPM, I found myself wondering, what if I changed this, and that, hmm, what about this. Compulsion forced me to tinker with the already excellent strategy to see what the effects of my ideas would have.

When I re-familiarized myself with GPM, as mentioned above, I began wondering how the strategy would perform if I made some changes to it. I will run through the changes that I pondered, and eventually tested, and a brief mention why I was looking at the specific change.

  1. Japan, one of the risk on assets in GPM is EWJ, Japan. While this choice didn't offend me, I wondered why not use a more broad geographical index like Pacific which is the entire region, not just Japan. Recently, the top countries represented in the Pacific ETF VPL were: 55% Japan, 20% Australia, 13% Republic of Korea, 7% Hong Kong, 3.4% Singapore, 1% New Zealand.
  2. Russell 2000, I have an affinity for Mid-Cap Russell indexes and wanted to see how the Russell Mid-Cap would do when swapped in for the Russell 2000 (small cap) index.
  3. Emerging Markets, I didn't like the idea of allocating up to 33% to Emerging Markets so I want to remove it entirely.
  4. Safety Assets, I wasn't sure why there wasn't an option to not just go into Short Term or Intermediate Treasuries, given the goal of the strategy I thought that BIL should also be an option.
  5. The strategy multiplies the returns and correlations and adds up the positive results, this number is used to scale into and out of the Risk On and Safety assets. Given the protective, low drawdown, nature of this strategy, I wondered, what if I add 1 to this count to force it to allocate a bit more to Risk On instead of the Safety assets.


After updating my implementation of TrendXplorer's GPM model and verifying the results where correct, I then began implementing my 5 ideas one by one to see how they worked out. My initial look at a strategy consists of looking at the CAGR, Maximum Drawdown, and UlcerIndex, here is what I found with the 5 changes listed above:

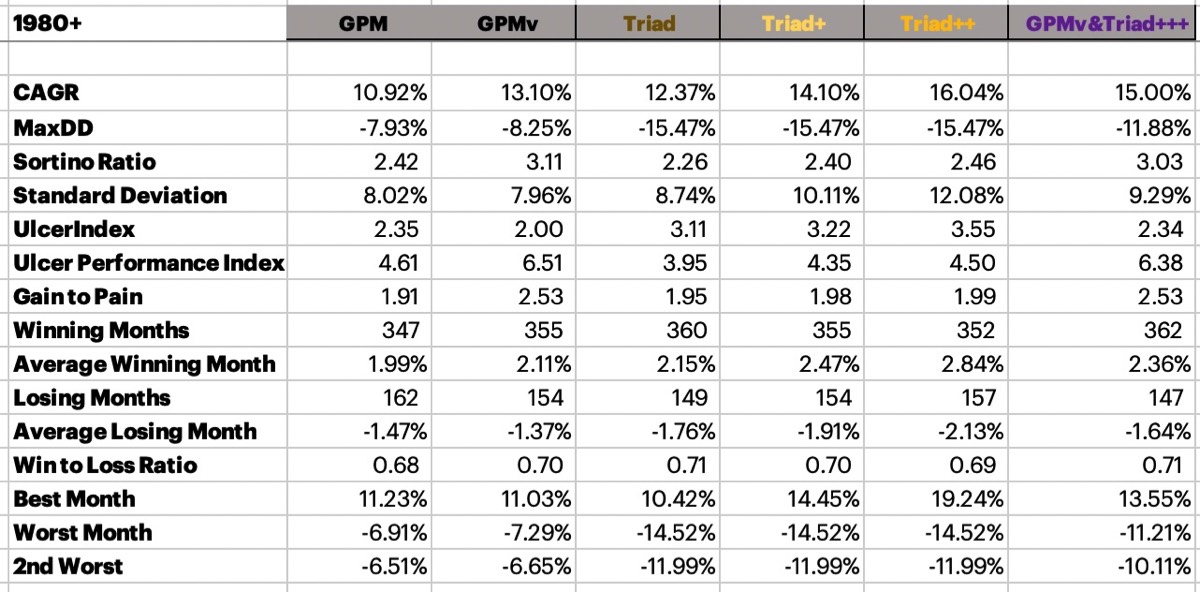
GPM, the base strategy has (from 1980 through May 23, 2020 - with my data set of returns): 10.90% CAGR, -7.93% MaxDD, 2.35 UlcerIndex

The changes below are individual, 1 looks at only changing Japan for Pacific, 2 only looks at changing Russell 2000 for Russell Mod-Cap, it isn't stacking Japan and Russell 2000 changes.
  1. VPL instead of EWJ: 10.86% CAGR, -9.13% MaxDD, 2.46 UlcerIndex I was okay with this being slightly worse, I knew that Japan had incredible returns during the late 80's, so de-prioritizing that a bit was likely to have a little bit of an adverse effect. I was more of the mind that Pacific was a more well rounded selection and maybe better going forward.
  2. Russell Mid-Cap instead of Russell 2000: 11.23% CAGR, -7.93% MaxDD, 2.33 UlcerIndex. This was a bigger improvement than I would have guessed.
  3. Removing Emerging Markets from the universe of Risky Assets (and changing calculations from using "12" to "11"): 10.79% CAGR, -9.35 MaxDD, 2.35 UlcerIndex. It surprised me that the MaxDD was a little higher, but not that the UlcerIndex was slightly lower and the CAGR slightly lower.
  4. Adding BIL as an option if both SHY and IEF had negative lookback: 11.27% CAGR, -7.93% MaxDD, 2.23 UlcerIndex. This is even better than I would have guessed.
  5. Changing the count of positive correlation * return assets by 1 to increase Risk On scaling: 11.65% CAGR, -10.05% MaxDD, 2.54 UlcerIndex. Spot on.


Each of the 5 changes seemed reasonable to me, and the 5 changes still keep the essence of the strategy in tact, these are more stylistic preferences than anything. This still very much looks and smells like GPM.

Question, What are the results of putting all 5 of those changes together?
Stacks Image 742
Serendipity, Synergy. Call it what you will, but I saw fireworks when I looked at the historical results of putting those 5 tweaks into the base GPM strategy. GPMv, short for GPMvariant, is what I am calling this strategy. It is the base GPM strategy with all 5 changes mentioned above, and I also swapped out SHY for VGSH, and IEF for VGIT, simply because I already use both VGSH and VGIT in my other models.

GPMv: 13.10% CAGR, -8.25% MaxDD, 2.00 UlcerIndex.

WOW - those are some seriously impressive numbers. S&P beating returns with such low drawdowns and low volatility.

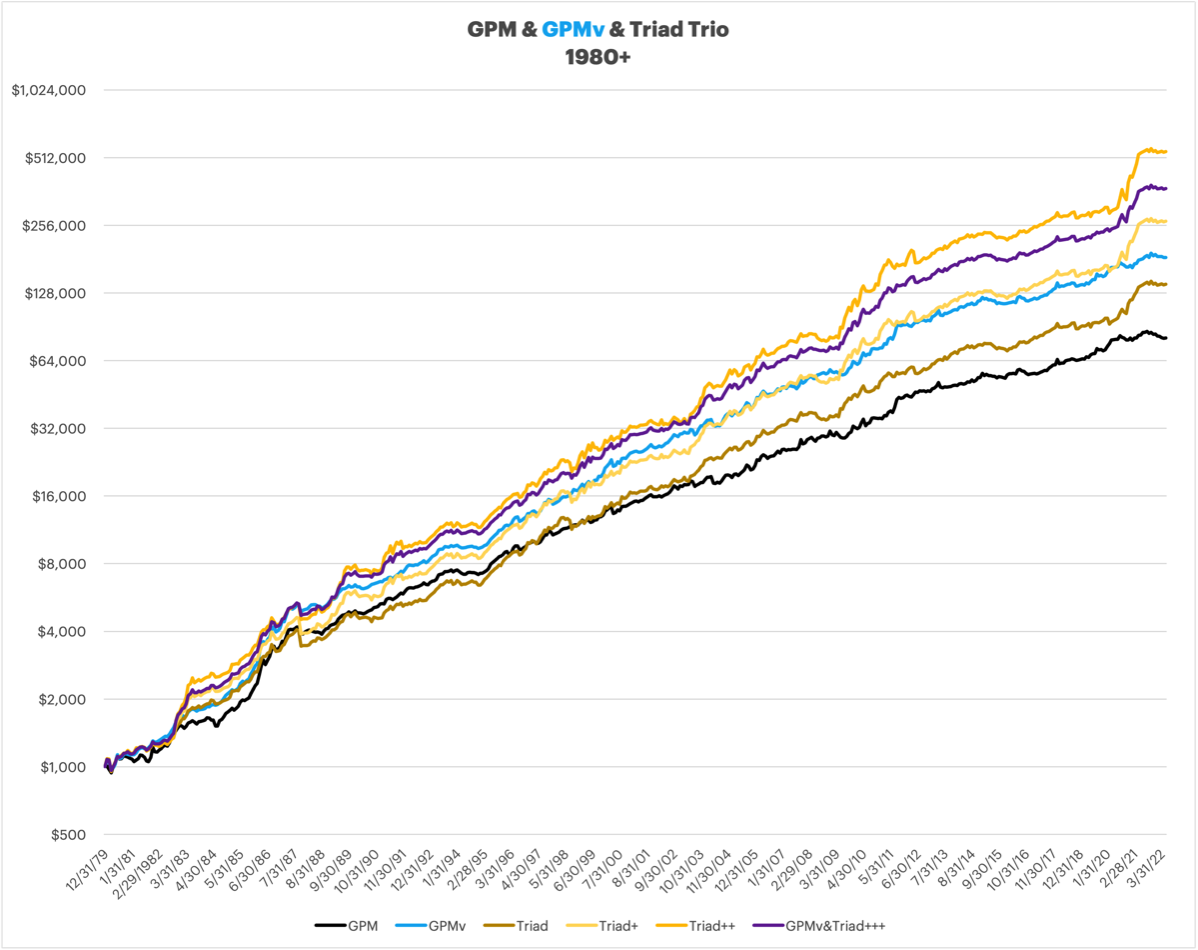
The next step for me was combining GPMv with my Triad++ strategy. Given my personal risk profile, I did 40% GPMv and 60% Triad++.

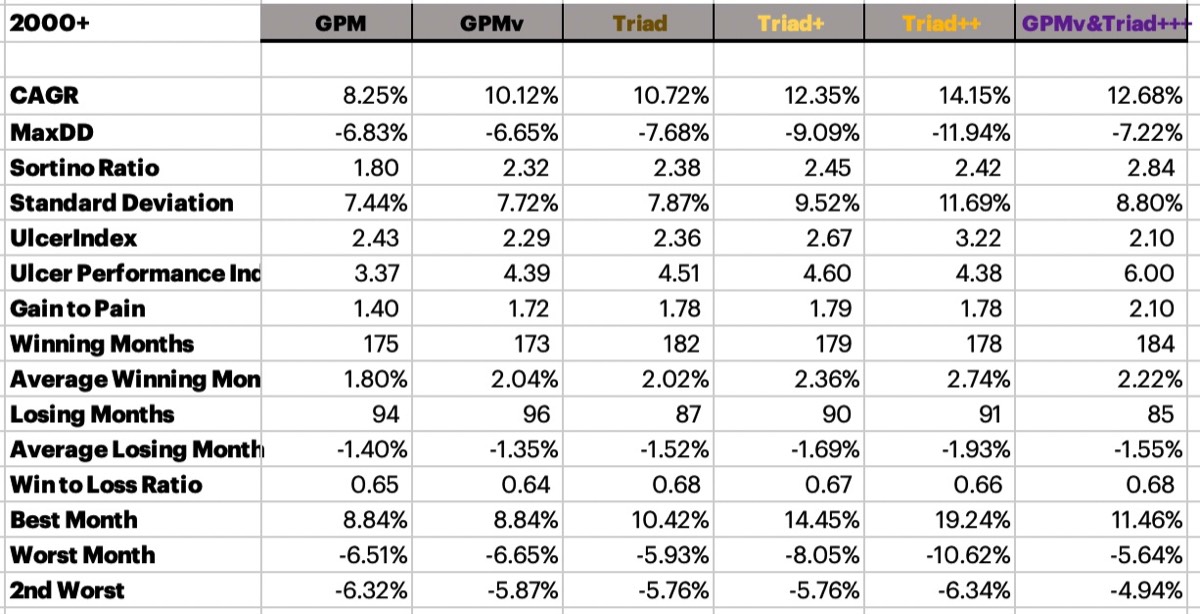
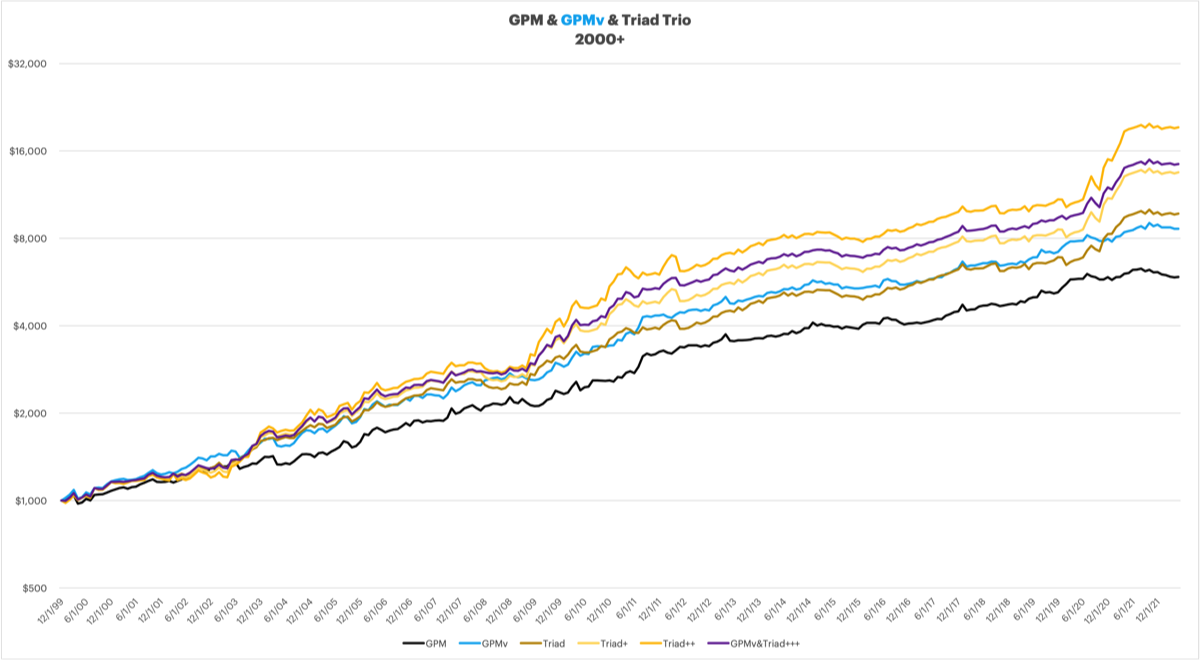
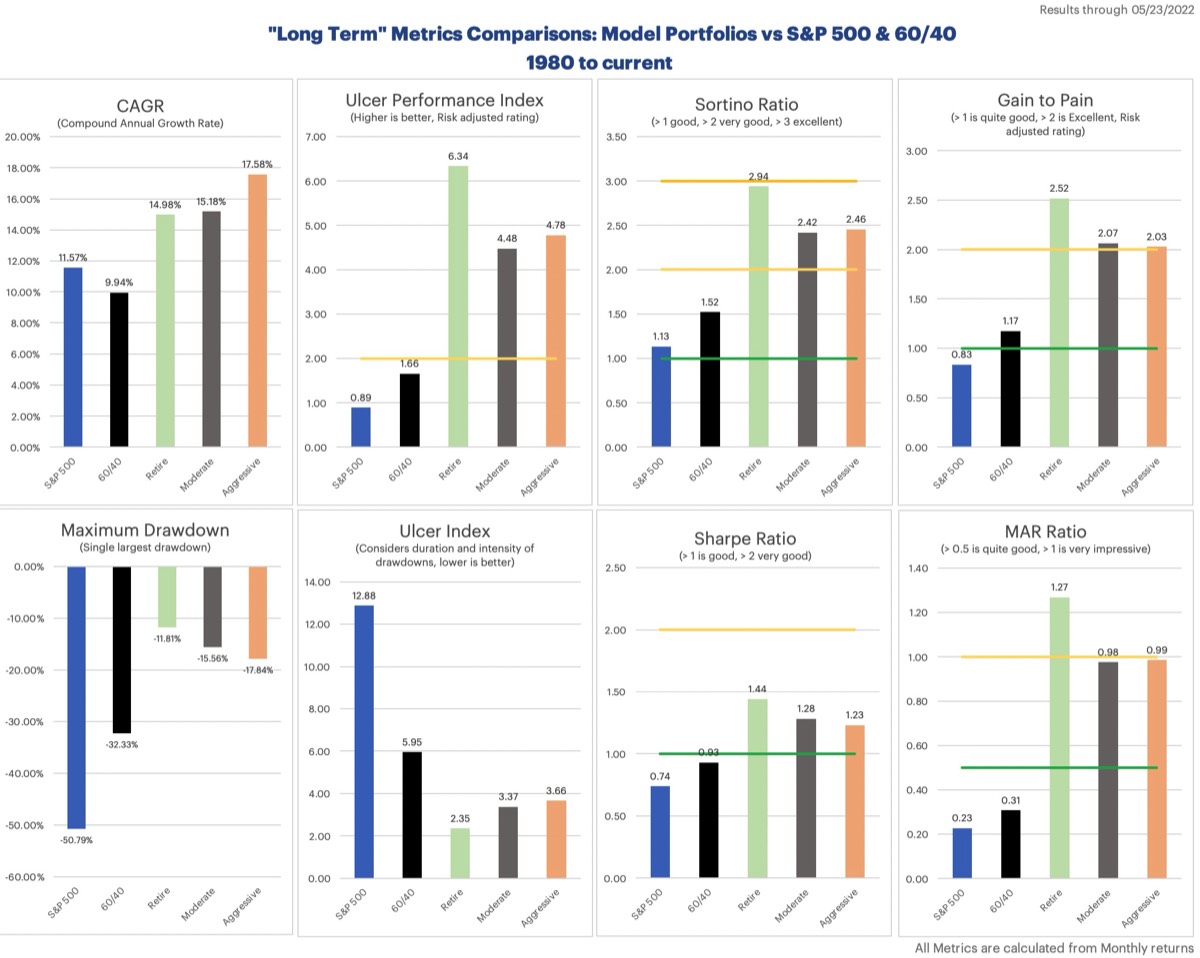
Below are the metrics the related strategies and combination for both 1980+ and 2000+.
Stacks Image 749
Stacks Image 752
Stacks Image 756
Stacks Image 760
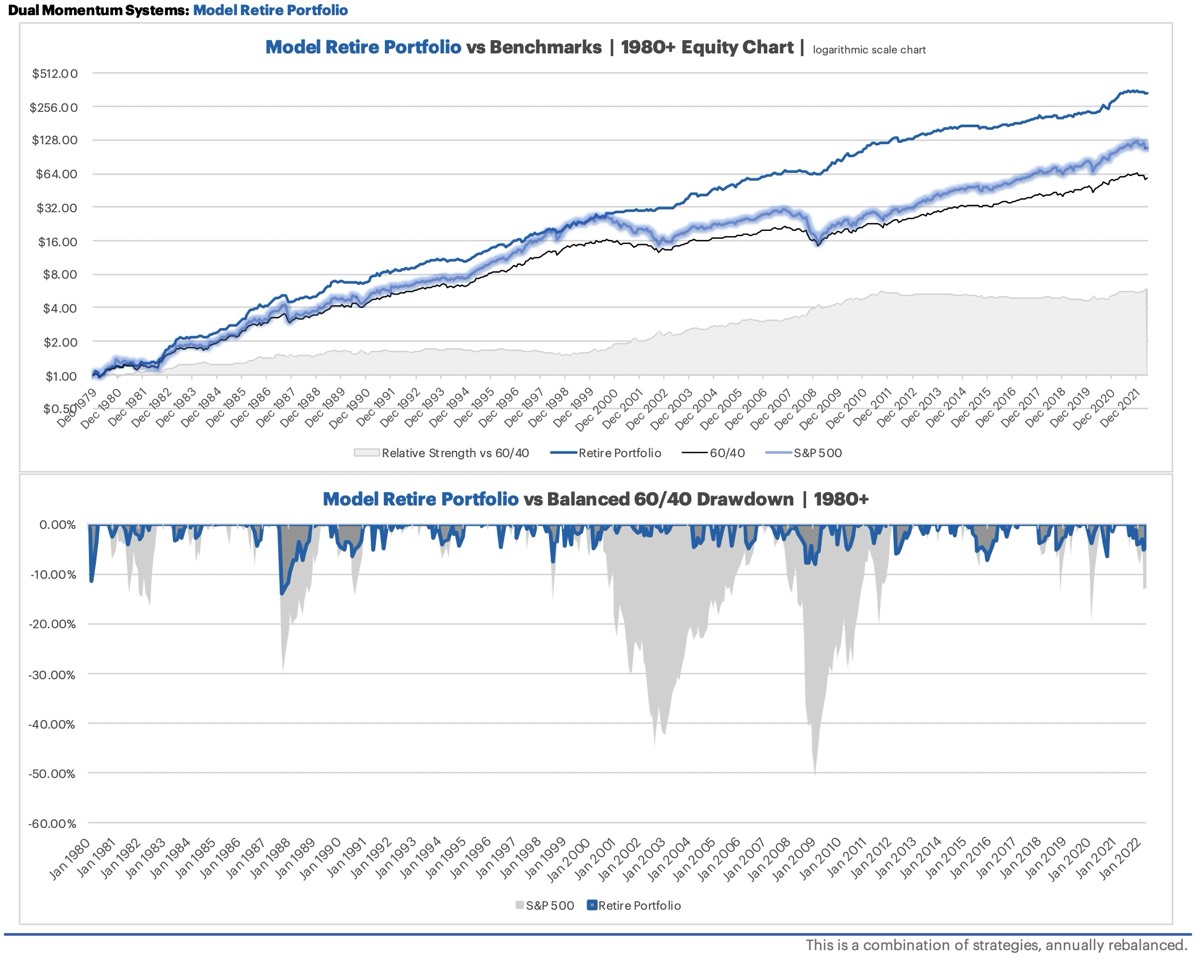
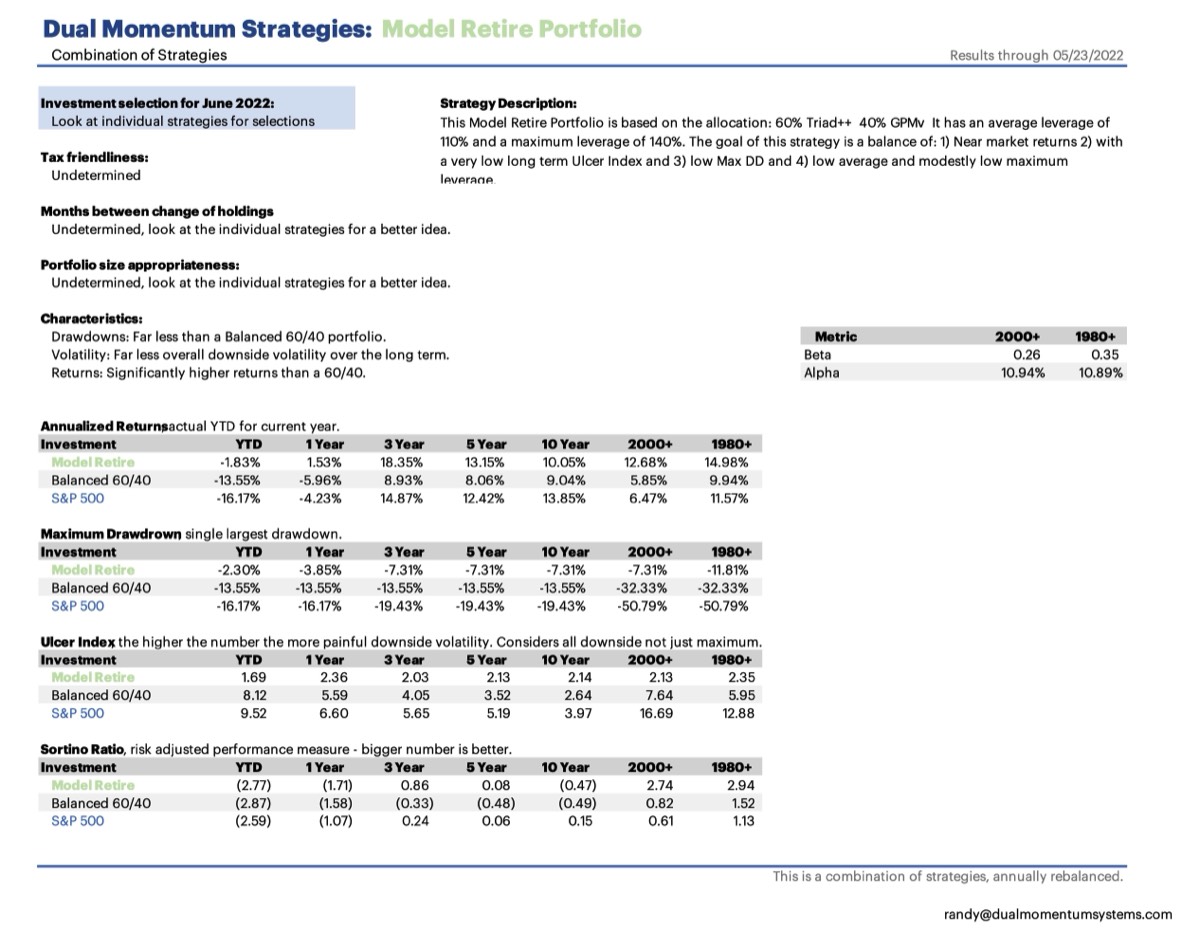
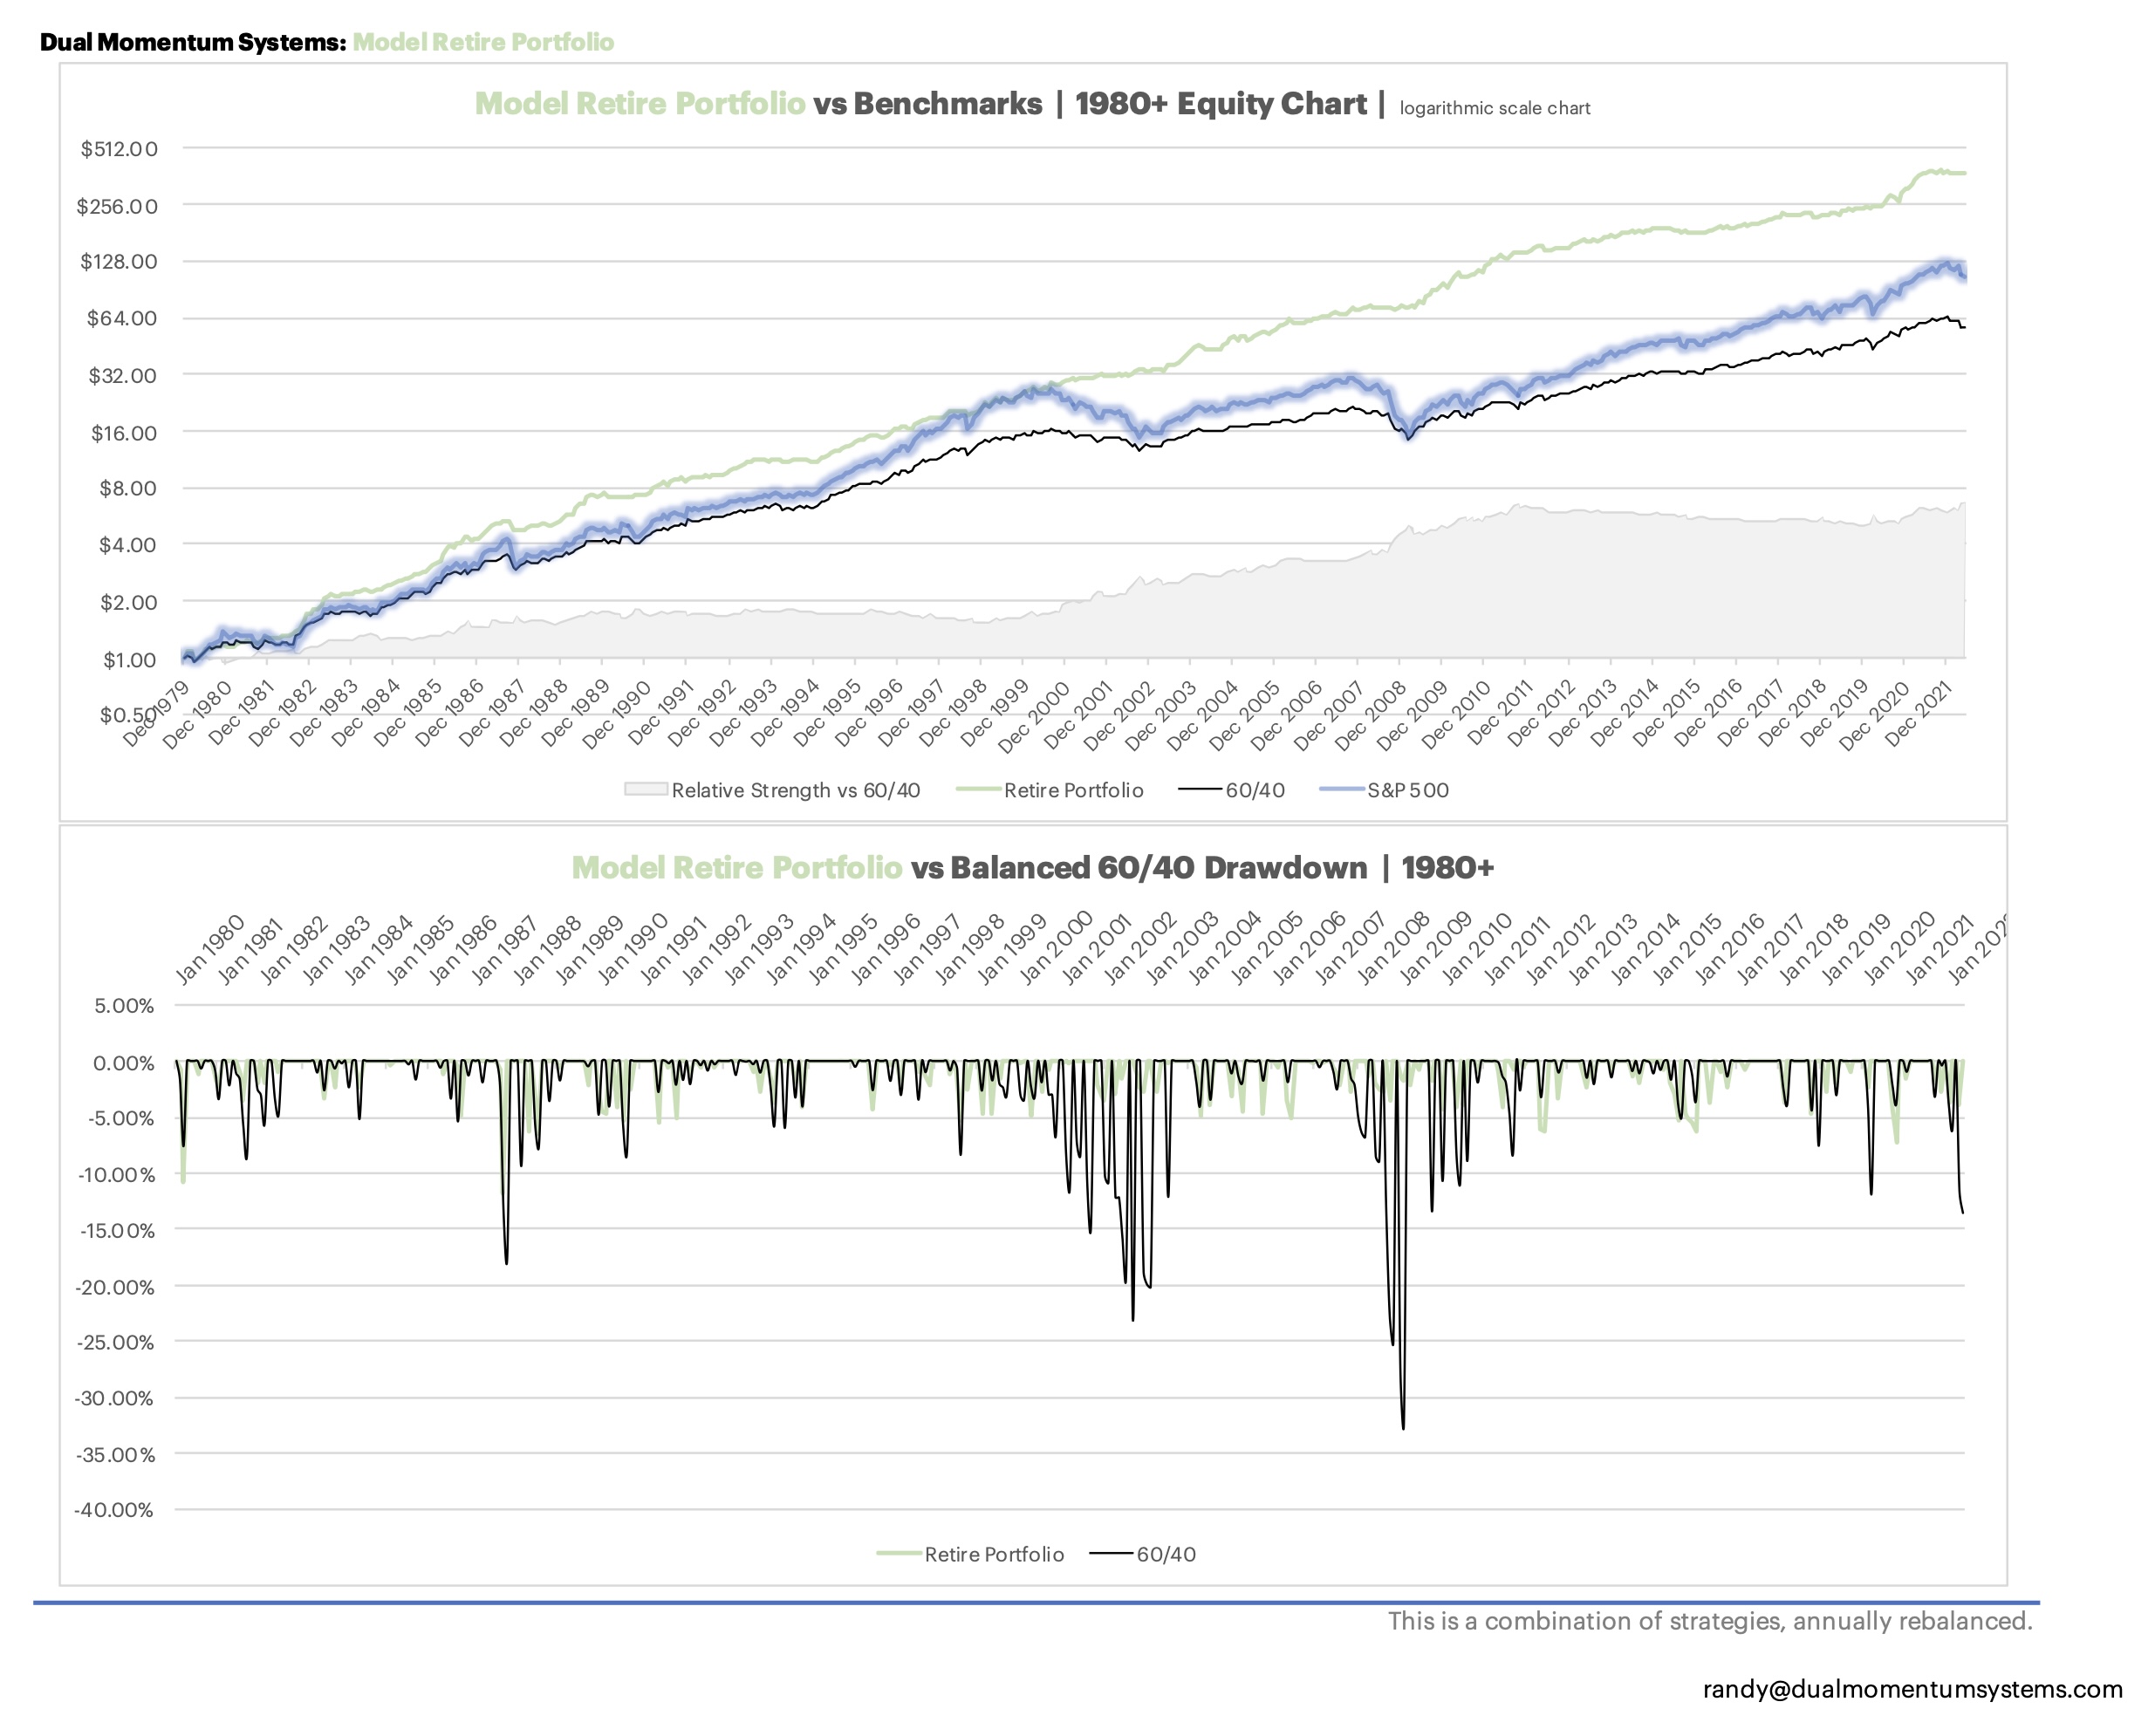
In the metrics and Fact Sheets below, the "Model Retirement" portfolio consists of 40% GPMv & 60% Triad++.
Stacks Image 768
Stacks Image 775
Stacks Image 772
Can we be certain that GPMv will perform as well in the future? No, of course not. However, regardless of the actual returns this strategy generates going forward, I think it is safe to say that it will continue to generate similar to market like returns over a full business cycle, and it will do so with far smaller drawdowns and far less volatility than a market portfolio. Isn't that about the best we could really ask for?

While I am not there yet, I am planning on GPMv to account for 40% of my retirement portfolio.

VTI out, IWB in: House Cleaning

VTI was still being used in Global Navigator+ while all of the other strategies used IWB. In efforts of streamlining and simplifying, I have changed Global Navigator+ ever so slightly by replacing VTI with IWB. There is virtually zero impact to past results or drawdowns, simply a housecleaning measure.

Strategy Naming Convention: House Cleaning

When naming the three Triad strategies which are differentiated only by the use of Smart Leverage, and 2X, and with 3X Smart Leverage I used Triad for the base strategy without any Smart Leverage. Triad+ for Smart Leverage using 2X, and Triad++ for Smart Leverage using 3X. I like this naming convention and adopted it to the other strategies as well.

LT Gain is now LT Gain+, LT Gain 3X is now LT Gain++, Global Navigator is now Global Navigator+.

Consistency in the naming.

TDL and the Triad Trio

The strategies (not Triad, it uses a different lookback and different risk off treasuries and bonds) went into treasuries for the months of February and March this year. During the month of February, treasuries didn't end the month terribly even though they underperformed the Russell 1000 most of the month, this chart below shows February 2022 for long duration treasuries and the Russell 1000. The treasuries lost about 1% less than the market.
Stacks Image 681
March was far worse for treasuries. Traditionally the treasuries act as a flight to safety and provide safety and returns when stocks aren't doing well, this didn't happen the 1st half of the month as stocks went down, Treasuries were down equally, then as the equities recovered and made gains, the treasuries lagged tremendously. Treasury yields have seen some of the biggest increases in this short of a time and has been devastating for the price of treasuries and bonds, especially the longer duration ones.
Stacks Image 687
This chart below, tweeted by Jim Bianco, shows the treasury returns year to date for all history available - this is the worst year on record so far. Just crazy, we've not seen this happen before.

The result is that we took a hit in March in the strategies like The Russell, Global Navigator, LT Gain, and LT Gain 3X. They went out of equities based on the model and ended up performing terribly in long duration treasuries.
Stacks Image 678
TDL, Treasury Duration Limiter, is something that I came up with after that terrible treasury performance in March, the goal is to restrict the strategy to short duration treasuries when going long duration presents too high of a risk. I ended up making TDL operate on the 30 year treasury yield, subtract the 5 year treasury yield, and if the spread is less than 1% then TDL kicks in and the strategy would go into short term instead of long duration treasuries.

Recently, I have been looking into TrendXplorer's Generalized Protective Momentum, GPM, strategy - it is of interest to me, particularly in a retirement portfolio. I found myself thinking about the strategy and making a couple changes based on my perspective to see how it looked on historical data. In my making a few adjustments to GPM I found myself implementing a TDL type filter for GPM, and it dawned on me that it should also work well for the DMS strategies.

It is elegantly simple, and works better than the 30 year - 5 year treasury yields so I have swapped out the inner workings of the TDL filter. TDL now simply looks at the weighted lookback of long duration treasuries, my weighted lookbacks for the strategies are 25% of the 1 month return, 25% of the 3 month return, and 50% of the 6 month return. However, I wanted this to be faster acting and more protective, so I changed the weighted lookback to 50% of the 1 month return, 25% of the 3 month return, and 25% of the 6 month return.

If we are risk off for multiple months, TDL can kick in at any month end, maybe in February we start off in long duration treasuries, but TDL kicks in for March so then we switch to short duration treasuries. The way I have TDL set, if in April the new signal is for long duration treasuries - we stay in the TDL limited option until we go back into equities. It avoids switching back and fort from long to short treasuries for those times when it is many months, the returns are not hurt and volatility is lowered.

I wish I had come up with this originally, I had it in my head that the risk off asset should be restricted from an outside metric, but as always, price is usually the best metric available.

This additional filter, TDL, to the strategies will help to protect us any time the long duration treasuries may not be a safe place to park our investments. The reporting deck for May will be complete with the updated TDL.
The Triad Trio!

Triad is one of the newer strategies, and it has become one of my favorites. When I was originally designing Triad last year, I wanted to include both gold and or commodities as up to a 1/6th investment option, but I wasn't able to source commodities monthly returns back to 1980 so decided to just leave it with gold as the option. I recently was able to obtain the monthly commodities returns back to before 1980 and have implemented it into the strategy.

The strategy will invest 1/6th of the strategy into either gold or commodities, whichever has the stronger relative momentum, and if neither has positive absolute momentum, then that 1/6th is invested into our safety holdings, treasuries or bonds.

I've decided to make Triad a little more robust in regards to International equities, similar to Global Navigator. Recency bias has everybody looking away from International and at the US Markets, but historically up until about 12 years ago, International markets had the same historical returns as the US, and they tend to outperform when the US Markets are underperforming.
Stacks Image 704
The chart above shows how there are periods when the International markets have outperformed the US markets. Triad now capitalizes on this situation. Similar to how Triad now invests in the stronger of gold or commodities, it will put 2/6th of the strategy into either the Russell Mid-Cap Value or International, whichever has the higher relative momentum. If neither of them have absolute momentum, then the 2/6th goes into the best performer of the bonds/treasuries.

The 2/6 allocation into the Russell 1000 remains unchanged.

Triad+ is the same as Triad, but adds Smart Leverage and will go into 2X S&P 500 instead of the Russell 1000 when going back into equities after a 15% or larger drawdown in the Russell 1000. This position is held until a natural change of investments in the strategy up to 1 year at which time the position is closed and we would de-leverage into the Russell 1000.

Triad++ is the same as Triad+ but the 2/6th position that would go into the Russell 1000, with Smart Leverage in Triad++ it would go into 3X S&P 500.

Even using 2X and 3X leverage with the 2/6th position the risk adjusted returns on the strategy are phenomenal, and for me it becomes a single strategy that fits more needs without having to combine multiple strategies. Note that leveraged equities do present a risk, a terrible month in the markets is amplified if in leveraged assets. This is not investment advice.

Going forward with the May Reporting Deck, all three Triad strategies will be included.

You can download the Fact Sheets for all three Triad strategies here.

I am really excited for the Triad offerings and am using them heavily myself. Please pay attention to the MAX Leverage of strategies. Triad++ has a 166% max leverage on it's own. the 2/6 position will effectively become 6/6 in Triad++ when it goes into UPRO. Triad always has at least 1/6 in treasuries/bonds, I personally don't consider that a 1:1 leverage the same as equities, but I didn't want to downplay the overall effective leverage all the same.

Happy Investing, geez, especially in this environment. If the couple people I follow who's opinions I respect are correct, we could see a really big drop still to come in the equities markets. Dual Momentum Systems strategies have had some whipsaw this year, and got caught in long duration treasuries in March, but they should fare well if faced with a large drawdown in the markets, and get us back in when they have some positive momentum.

The perfect portfolio allocation is

After the drop in March 2020 the markets went pretty smoothly up through late 2021, it was a long run which made for large gains. An investor with a more risk averse portfolio would have been more modestly invested than the market, and possibly feeling a bit of FOMO during that boom time. However, we have had a bit of a drawdown since late 2021 and now that more moderate portfolio is looking pretty good and there is currently no FOMO when you are not going down nearly as much as the markets.
Stacks Image 647
Stacks Image 651
When putting your portfolio together, it is a good idea to take the full market cycle and the possible swings that you may incur into account, consider both the good and the bad times. For example, it would be easy to look at the LT gain 3X strategy and it’s excellent risk adjusted metrics, say to yourself - that’s for me! 100% allocation to it (I had somebody tell me this in email just the other day.) And while the use of Smart Leverage improves the chances of not suffering a massive drawdown - it is still entirely possible. Think back to 2008, we had a period of time that did well in the middle of the drawdown. The DMS strategies happened to not go back into equities until around May 2009 but let’s play devils advocate and say that maybe the market had enough of a rise in the middle of the huge down trend that it triggered a buy signal and if you went in at that time with 100% at 3X leverage and let’s say for arguments sake that the market dumped 20% the next month, you would now be looking at a 60% drawdown in your portfolio in just one month. This is an entirely feasible possibility even though in all the many years of backtesting it never has. Let’s face it, as we are this year seeing the largest drawdowns in bonds that have ever happened, shit does happen.

I find backtesting strategies to be a really good idea to see how events of the past effect the strategy, going back in time to kick the tires. But a backtest doesn't mean that the worst is behind us. To paraphrase Meb Faber, "your largest drawdown is always ahead of you." And while on the topic of backtesting to kick the tires, I have stated it before but be want to reiterate that I do not tweak the strategies so that it they handle past events better. I have no interest in trying to make them look better over the backtest, I put my money into these strategies and am not trying to fool anybody, myself included. Enhancements to the strategies evolve over time, adding Smart Leverage and Treasury Duration Limiter, "Necessity is the mother of all innovation" comes to mind. I have added these items with the goal of improving future performance and reducing volatility. What I do not do is tweak things to avoid a certain drop in the past, or take advantage of something - that is not what these strategies are about.

I appreciate low drawdowns and high risk adjusted metrics. This is why all of the Model Portfolios now shown in the Reporting Decks (even the current Model Aggressive Portfolio) has an allocation to Triad+, it is a low volatility strategy with superior risk adjusted metrics. There is a larger allocation to Triad+ in the more conservative Model Portfolio's, but still a 30% allocation to it in the Model Aggressive Portfolio. For all the Model Portfolios I show the average leverage and the maximum leverage. The Model Aggressive Portfolio currently shows an average leverage of 114% (from 1980 forward) and a maximum leverage of 220%. These two numbers tell you that on AVERAGE the strategy is not usually leveraged, but when it is, it has a 220% allocation which is significant. Don't allocate to this thinking the leverage is 114%, that is the average, normally there will be no leverage at all, but at times it will be nearly 220%.

The Model Portfolios are not intended to be a one size fits all, but an example of how the strategies can be combined for an improved overall allocation. One person my look at the Retirement portfolio and say it is far too aggressive for them. Maybe they want 70% Triad and 30% cash. Another person maybe with large retirement balances may be see the Model Aggressive Portfolio as not nearly aggressive enough since they have a large buffer. If you want to see the stats for a specific combination of strategies shoot me a note and I'll run it if I have a minute.

Risk tolerances are very personal, only you know what is too much risk for you. I have a rather modest risk tolerance, which is in part how I ended up looking to systematic strategies and developing the DMS strategies - I don’t like the volatility and large drawdowns that come along once in a while when holding the market. Even holding a dozen or more individual securities can have far more volatility than say IWB. I don’t think that individual investors (or professionals) can sustainably pick companies that outperform the market. This is why most professionals and virtually all retail investors are substantially outperformed in terms of raw gains by the market over time. I am also very results oriented, so if the strategies are underperforming the market - I have to remind myself that this will happen, we will catch up in the bad times, and accelerate with smart leverage after the bad times, this isn’t a daily, monthly, quarterly or even annual game - we will win it over the longer run.

With the bond bull market over (or nearly over), the S&P being too much for most people to buy and hold, and the 60/40 looking very out of favor in the current bond environment - a systematic investing approach, like the strategies offered here at DMS seems more rational than ever.

Please reach out with any questions, share with your family and friends, allocate appropriately.