Recent Appreciation

Several people have written nice "Thank You's" the past couple of weeks, it was really nice to receive these comments.

Given that these DMS strategies are for a DIY investor who appreciates the strategies, understands how they work, and appreciate their goals, pros and cons. I really appreciate that these strategies strike a chord with some investors. :)
...just wanted to say this is great work and I had been looking for something like this for awhile. So for that, thank you.
Garrett B
Thank you for providing such a wealth of great information, Randy!
Keith P
Thank you for taking the time to create your amazing site. It is such a valuable resource.
Daniel M
I've spent hours and hours reading over your strategy, on the website. This is absolutely top shelf. Thank you for making this work available.
Nathan H

Bear Market Correlations

When I glanced at the Finviz.com heat map this morning, I was reminded of the saying "All correlations go to one in a bear market."
Stacks Image 839

Changing from DBC to PDBC

Housekeeping: Swapping out DBC in favor of PDBC in the strategies which use Commodities, GPMv and the Triad trio.

Thanks to Garrett B for alerting me to PDBC. Both DBC and PDBC are fund from Invesco they have extremely similar results, PDBC has the advantage of no K1. DBC is structurally a Commodity Pool (managed futures), while PDBC is an ETF. Both trade easily and similarly, but PDBC does not issue a K1 which is simpler at tax time.

For more information on the distinction between Commodity Pools and ETF's: Investopedia link

You can see in the chart below of returns for both DBC and PDBC, they are virtually in lock step.
Stacks Image 830

How much leverage is the right amount?

Stacks Image 806
It is common for people to use leverage, whether in the form of leveraged ETF's, margin, or futures as a way of enhancing returns when things are going well in the markets. The problem is that leverage cuts both ways, it can dramatically increase your gains, and it can also dramatically increase your drawdowns.

It is not only retail investors getting 'greedy' using leverage either, did you know that not only do Hedge Funds use a lot of leverage, but even Berkshire Hathaway is usually using leverage? I didn't dig into it, but it appears that they often use 1.2x to 2.0x leverage, and they are generally considered to be conservative. You may recall how Long Term Capital Management blew up from using too much leverage, when things went against them.

Having looked at the risk adjusted returns for holding leveraged ETF's for long periods of time, it is shocking how much volatility and drawdowns they can incur. But Fear Of Missing Out, FOMO, still taunts people to try and enhance returns.

I got more aggressive in 2021, not long before the market rolled over and got stung as a result. Not a mortal wound, but a good lesson to not leverage up too much. The truth is, I was leveraged more than I was comfortable with, but it didn't rear it's ugly head until things turned downward.

Many of the DMS strategies take advantage of Smart Leverage, which is designed to only leverage up when the odds are in our favor for doing well, however, this doesn't mean that being 100% invested in LT Gain++ is a terrific idea because there will be times when you are 300% leveraged. Certainly some people can handle that volatility, not me!

With less than a week to go before June has completed, it looks like we may trigger Smart Leverage this month. As a reminder, Smart Leverage looks at drawdowns in IWB from the month end high water mark to the current month end results, when this reflects a drawdown of 15% or greater, Smart Leverage is triggered, and when we go back into equities we do so with leverage. The "+" strategies use 2X, SSO, the "++" strategies use 3X, UPRO.

Triad only has a maximum allocation of 1/3rd to IWB, the Russell 1000. So even if you are in Triad++, the maximum leveraged position you have to the market is 100% for the IWB portion (1/3 x 3X), and it could still have 1/3rd in either Russell Mid-Cap Value, or Foreign, and also up to 1/6th position in either Gold or Commodities. This is an amount of leverage that I am personally good with. At this point in my life, I don't want the volatility or risks that come from being overly leveraged and my recent fall from grace was an excellent reminder of this. If you don't learn from your mistakes, you are likely to repeat them.

If you are investing in the DMS strategies, please consider the leverage you will be taking when we go back into equities if/when Smart Leverage is triggered. It would not be out of the question whatsoever to see a 20% loss in a month for the overall market, and if you are 100% in 3X leveraged strategies, that would equate to near a 60% loss for the month. That would be a significantly huge loss in the span of one month. Caution is advised. Consider your allocation, and not just how you will do if things work out as we hope, but please also consider the downside possibility and what that would mean for your portfolio.

My personal allocation is similar to the Model Portfolio Retirement allocation as shown recently in the Reporting Decks. Which is 35% GPMv, 50% Triad++, and 15% IWR (Russell Mid-Cap). As shown in the reporting deck, this allocation has a backtested history of terrific returns that are above market performance, with far less volatility and drawdowns. Seems like a great path for me to follow. Note that I do have my kids more aggressively allocated, but not too much maximum leverage. The Reporting Decks show both the Maximum and Average Leverage for each strategy and Model Portfolio. While the Average Leverage is important to note, it is the Maximum Leverage that one needs to pay the most attention to.
Stacks Image 815

GPMv is born

When I was scouring the internet, gaining interest in Tactical Asset Allocation strategies, TAA, I found myself on JW Keuning's website Index Swing Trader by his online name TrendXplorer. TrendXplorer and his co-hort in several strategies Wouter Keller have come up with some really interesting strategies. They iterated Protective Asset Allocation, PAA, to become Generalized Protective Momentum, GPM. The goal as TrendXplorer told me was extremely low drawdown, low drawdowns were given higher priority over returns. When I first ran across GPM, honestly I thought it was rather unique and brilliant how they used the correlations and used the positive count to scale into and out of the Risk On universe and the Safety assets. However, I also thought - BORING.

Some times, boring is good, in fact boring can be great. It took me a few years to come around to it, but I recently found myself investigating retirement portfolios for myself, not for today - but not too far off in the future. It was during this investigation that I found myself looking at GPM once again, and viewing it in a different light.

When people are accumulating assets, it is often the case that more risk and less diversity is taken. This can work well for capital growth, albeit likely accompanied with higher volatility. In retirement though, steady eddy is the goal. The lower the volatility the more reliable a portfolio is for drawing money in retirement without too large drawdowns. It is why allocation strategies like Golden Butterfly, Permanent Portfolio, and All Weather each far outperform the general market in retirement, they are far less volatile than the overall market and this keeps drawdowns from getting too large.

If you are familiar with this Dual Momentum Systems website, you likely know that my Global Navigator+ strategy is largely a derivative of Gary Antonacci's GEM strategy. I have a faster acting weighted lookback, and have implemented Smart Leverage for greater growth opportunities and Treasury Duration Limiter for safer Risk Off, but in a general sense you can see the resemblance. The Russell is a bit more varied from GEM. The LT Gain strategies, like Global Navigator+ you can see have inspiration from GEM, again with my take on them with the Single Momentum, the lookback, Smart Leverage, and Treasury Duration Limiter. The Triad Strategies are I would like to think wholly my own, there may be resemblance to other strategies, but I really came up with them without any inspiration of other strategies. I mention the strategies only to say that when I re-visted GPM, I found myself wondering, what if I changed this, and that, hmm, what about this. Compulsion forced me to tinker with the already excellent strategy to see what the effects of my ideas would have.

When I re-familiarized myself with GPM, as mentioned above, I began wondering how the strategy would perform if I made some changes to it. I will run through the changes that I pondered, and eventually tested, and a brief mention why I was looking at the specific change.

  1. Japan, one of the risk on assets in GPM is EWJ, Japan. While this choice didn't offend me, I wondered why not use a more broad geographical index like Pacific which is the entire region, not just Japan. Recently, the top countries represented in the Pacific ETF VPL were: 55% Japan, 20% Australia, 13% Republic of Korea, 7% Hong Kong, 3.4% Singapore, 1% New Zealand.
  2. Russell 2000, I have an affinity for Mid-Cap Russell indexes and wanted to see how the Russell Mid-Cap would do when swapped in for the Russell 2000 (small cap) index.
  3. Emerging Markets, I didn't like the idea of allocating up to 33% to Emerging Markets so I want to remove it entirely.
  4. Safety Assets, I wasn't sure why there wasn't an option to not just go into Short Term or Intermediate Treasuries, given the goal of the strategy I thought that BIL should also be an option.
  5. The strategy multiplies the returns and correlations and adds up the positive results, this number is used to scale into and out of the Risk On and Safety assets. Given the protective, low drawdown, nature of this strategy, I wondered, what if I add 1 to this count to force it to allocate a bit more to Risk On instead of the Safety assets.


After updating my implementation of TrendXplorer's GPM model and verifying the results where correct, I then began implementing my 5 ideas one by one to see how they worked out. My initial look at a strategy consists of looking at the CAGR, Maximum Drawdown, and UlcerIndex, here is what I found with the 5 changes listed above:

GPM, the base strategy has (from 1980 through May 23, 2020 - with my data set of returns): 10.90% CAGR, -7.93% MaxDD, 2.35 UlcerIndex

The changes below are individual, 1 looks at only changing Japan for Pacific, 2 only looks at changing Russell 2000 for Russell Mod-Cap, it isn't stacking Japan and Russell 2000 changes.
  1. VPL instead of EWJ: 10.86% CAGR, -9.13% MaxDD, 2.46 UlcerIndex I was okay with this being slightly worse, I knew that Japan had incredible returns during the late 80's, so de-prioritizing that a bit was likely to have a little bit of an adverse effect. I was more of the mind that Pacific was a more well rounded selection and maybe better going forward.
  2. Russell Mid-Cap instead of Russell 2000: 11.23% CAGR, -7.93% MaxDD, 2.33 UlcerIndex. This was a bigger improvement than I would have guessed.
  3. Removing Emerging Markets from the universe of Risky Assets (and changing calculations from using "12" to "11"): 10.79% CAGR, -9.35 MaxDD, 2.35 UlcerIndex. It surprised me that the MaxDD was a little higher, but not that the UlcerIndex was slightly lower and the CAGR slightly lower.
  4. Adding BIL as an option if both SHY and IEF had negative lookback: 11.27% CAGR, -7.93% MaxDD, 2.23 UlcerIndex. This is even better than I would have guessed.
  5. Changing the count of positive correlation * return assets by 1 to increase Risk On scaling: 11.65% CAGR, -10.05% MaxDD, 2.54 UlcerIndex. Spot on.


Each of the 5 changes seemed reasonable to me, and the 5 changes still keep the essence of the strategy in tact, these are more stylistic preferences than anything. This still very much looks and smells like GPM.

Question, What are the results of putting all 5 of those changes together?
Stacks Image 742
Serendipity, Synergy. Call it what you will, but I saw fireworks when I looked at the historical results of putting those 5 tweaks into the base GPM strategy. GPMv, short for GPMvariant, is what I am calling this strategy. It is the base GPM strategy with all 5 changes mentioned above, and I also swapped out SHY for VGSH, and IEF for VGIT, simply because I already use both VGSH and VGIT in my other models.

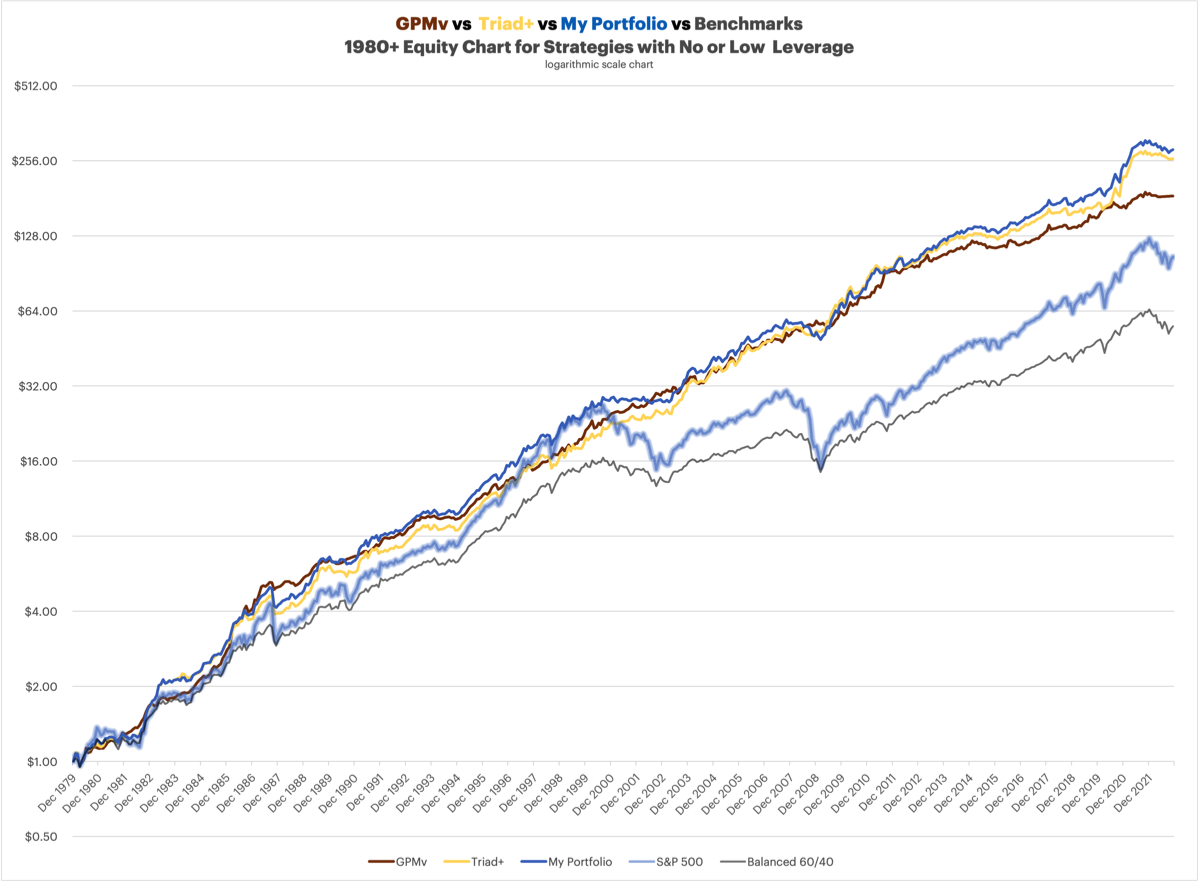
GPMv: 13.10% CAGR, -8.25% MaxDD, 2.00 UlcerIndex.

WOW - those are some seriously impressive numbers. S&P beating returns with such low drawdowns and low volatility.

The next step for me was combining GPMv with my Triad++ strategy. Given my personal risk profile, I did 40% GPMv and 60% Triad++.

Below are the metrics the related strategies and combination for both 1980+ and 2000+.
Stacks Image 749
Stacks Image 752
Stacks Image 756
Stacks Image 760
In the metrics and Fact Sheets below, the "Model Retirement" portfolio consists of 40% GPMv & 60% Triad++.
Stacks Image 768
Stacks Image 775
Stacks Image 772
Can we be certain that GPMv will perform as well in the future? No, of course not. However, regardless of the actual returns this strategy generates going forward, I think it is safe to say that it will continue to generate similar to market like returns over a full business cycle, and it will do so with far smaller drawdowns and far less volatility than a market portfolio. Isn't that about the best we could really ask for?

While I am not there yet, I am planning on GPMv to account for 40% of my retirement portfolio.