Introducing Lowkey: A Different Balanced Portfolio for Investors Who Would Rather Not Fiddle
There are people who like the idea of a rules-based strategy, they understand why stepping aside during a major decline matters. But they do not want to have to rearrange their portfolio every month or two. It is too fiddly. They would happily check in now and then, and they would prefer to sidestep the big market drawdowns, but other than that they just want to stay invested and not think about it very much.
That is a perfectly reasonable thing to want - for many life is busy and they sometimes just prefer to not have too active of an investment strategy added into the mix. Most tactical asset allocation strategies are built to be right as often as possible, and being right often means trading often.
Lowkey is my answer for that investor. Low turnover, low hassle, and a portfolio that is easy to stay with over time.
What Lowkey is
Lowkey holds two DMS strategies:
- Carrier at 50%, the growth engine.
- Permanent Portfolio DMS at 50%, the all-weather ballast.
Once a year, in January, it resets to 50/50. The rest of the year the weights drift. No leverage, ever.
If you read the Carrier introduction two weeks ago, you already know the first half. Carrier holds a stock-led growth mix and stays invested unless the high yield credit spread says the market is under real stress, which in practice means it is invested most of the time and changes position less than once a year on average.
Permanent Portfolio DMS is the other half, and it is almost the opposite kind of strategy. It never takes a view. It holds four quadrants built for four kinds of economy: long/short equity for prosperity, managed futures for recession, gold for inflation, and tail-risk convexity for crisis. It rebalances once a year and otherwise just sits there.
A different balanced portfolio
Sixty percent stocks and forty percent bonds has been the default balanced portfolio for generations, and the logic is sound as long as bonds rise when stocks fall. In 2022 they did not. Stocks and bonds fell together and the classic 60/40 lost about 18% that year.
Lowkey keeps the idea of a growth half and a cushion half and changes what is in each. The growth half is a strategy that steps aside when credit markets signal trouble, rather than an index that is always all-in. The cushion half is a four-quadrant portfolio designed for several economic regimes, rather than a bond fund that depends on one relationship holding.
Why these two belong together
Carrier and Permanent Portfolio DMS have a monthly correlation of 0.57. More importantly, they tend to have their bad stretches at different times.
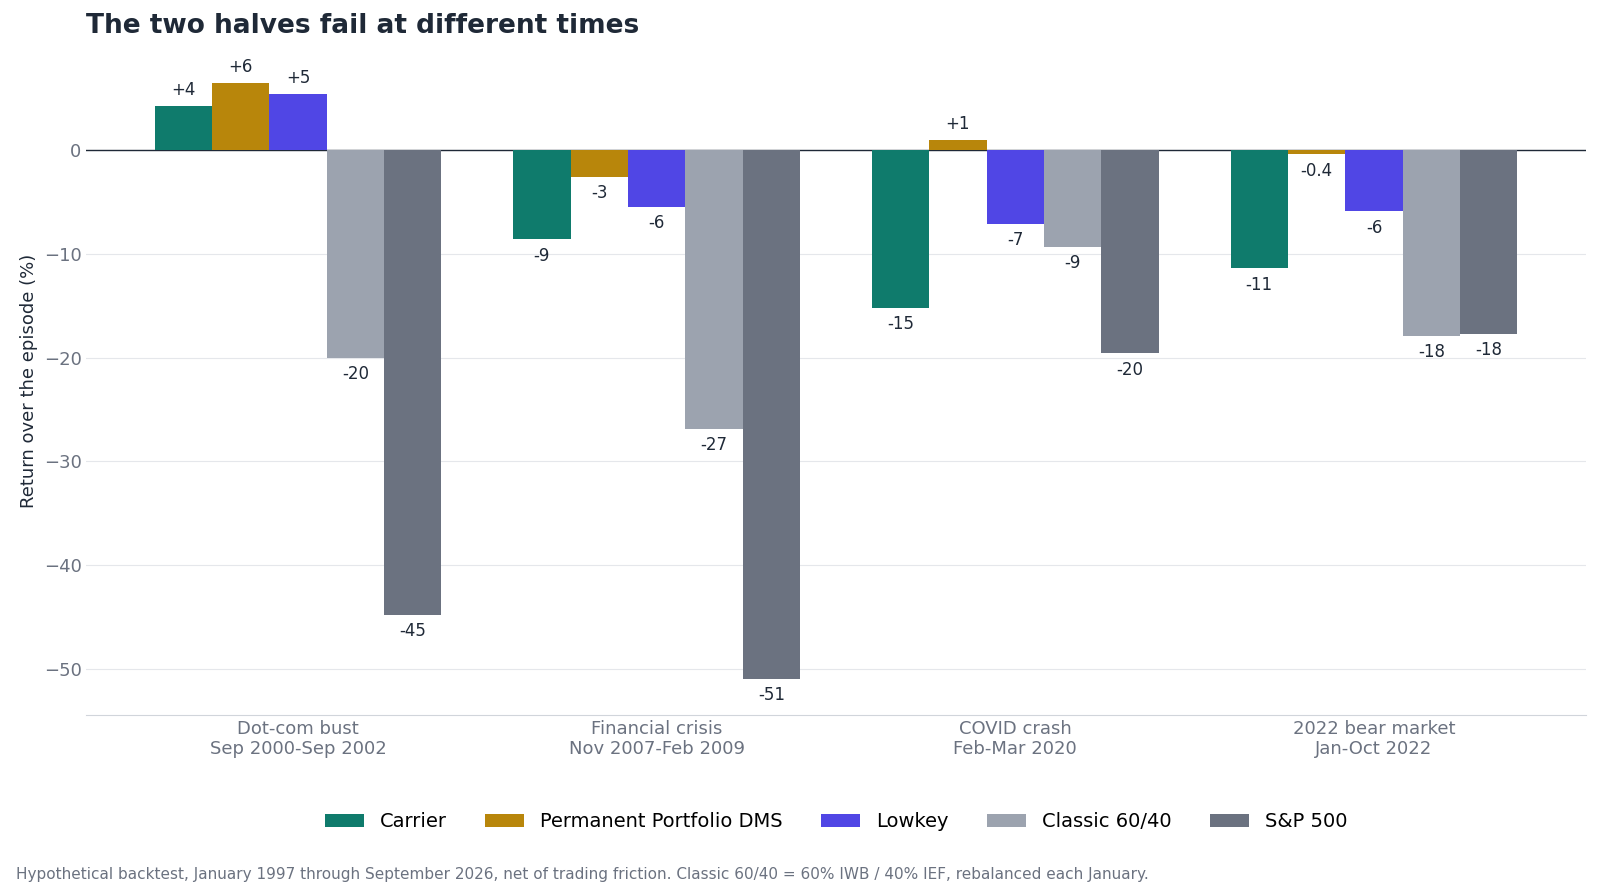
Permanent Portfolio DMS held its ground through every one of the big equity crises in this record: up 6% through the dot-com bust, down 3% through the financial crisis, up 1% in the COVID crash and roughly flat through the 2022 bear market. Carrier gained 4% through the dot-com bust, because its credit signal got it out, and took losses in the other three.
Put them together and Lowkey's losses in the two fast crises were about half of Carrier's, about two-thirds of Carrier's in the financial crisis, and a fraction of the classic 60/40's in all three.
The results
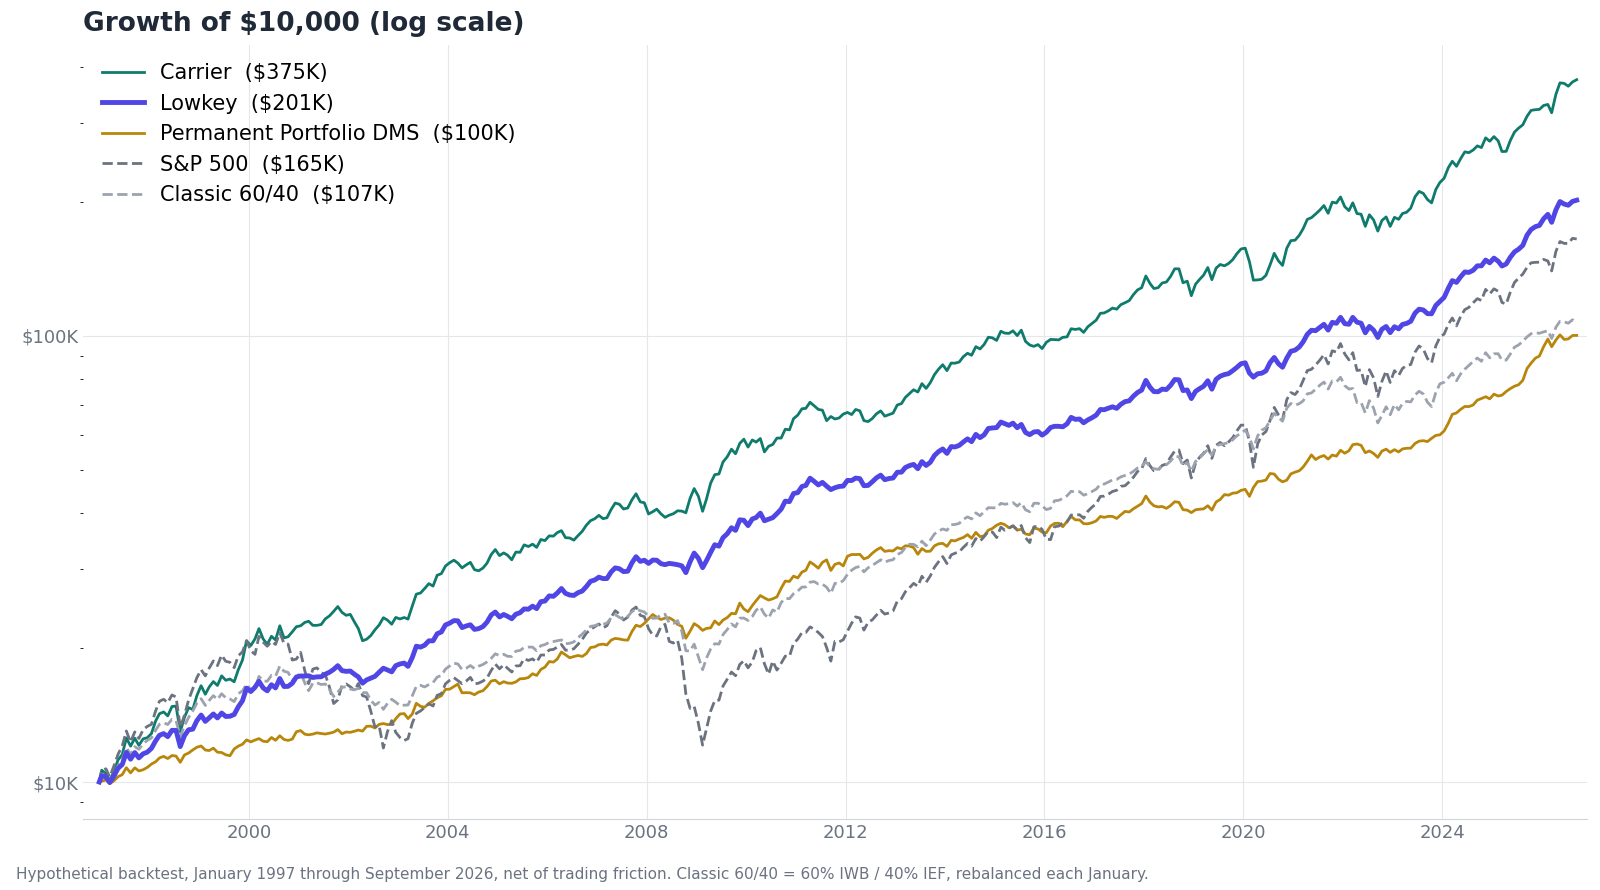
Every figure runs January 1997 through September 2026, net of trading friction. The start date is where Carrier's credit spread history begins.
| CAGR | Max DD | Ulcer Index | UPI | Worst year | |
|---|---|---|---|---|---|
| Lowkey | 10.62% | -9.88% | 2.62 | 3.22 | -7.6% (2022) |
| Carrier | 12.96% | -16.17% | 4.77 | 2.26 | -14.1% (2022) |
| Permanent Portfolio DMS | 8.06% | -11.53% | 2.40 | 2.44 | -4.5% (2018) |
| Classic 60/40 | 8.29% | -26.90% | 6.44 | 0.95 | -17.6% (2022) |
| S&P 500 | 9.88% | -50.97% | 15.11 | 0.51 | -37.0% (2008) |
Classic 60/40 is 60% U.S. large cap (IWB) and 40% intermediate Treasuries (IEF), rebalanced each January.
A few things stand out.
Lowkey scores a better UPI than either of its own components, and a shallower worst decline than either. That is the whole point of combining two things that struggle at different times. Lowkey gives up a little over two percentage points a year against Carrier on its own, and in exchange its worst decline falls from -16% to under -10% and its Ulcer Index drops by about 45%.
Against the classic 60/40, it is not close. More than two points a year more return, with well under half the worst decline and well under half the Ulcer Index.
It beat the S&P 500 by about three-quarters of a point a year, with a worst decline one fifth as deep.
What a bad year looks like
This is the part that matters most for staying with something.
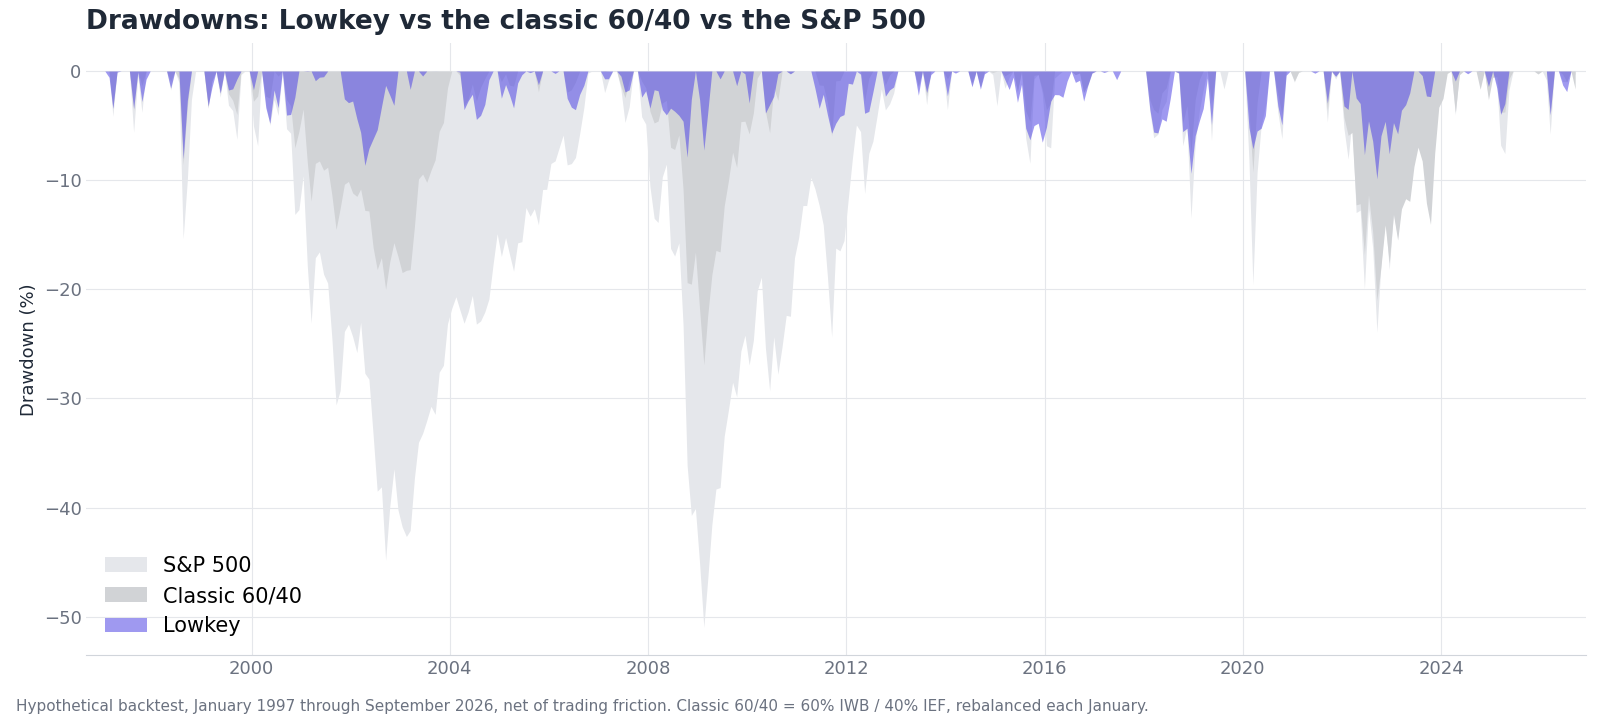
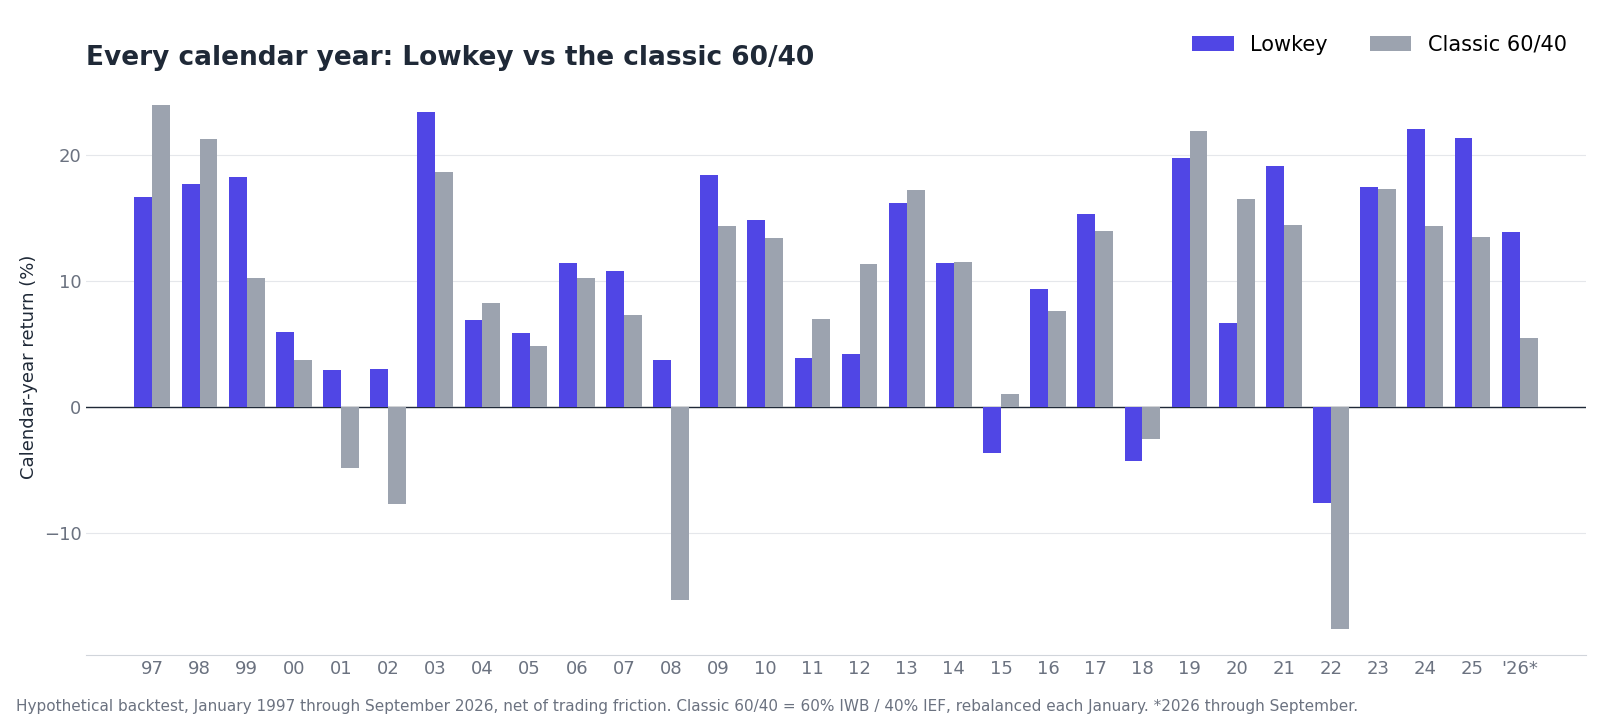
Lowkey had three down years out of 29 full calendar years: 2015 at -3.6%, 2018 at -4.3% and 2022 at -7.6%. Its worst rolling three-year stretch still returned a positive 2.6% a year. The classic 60/40 had five down years in the same period, the worst of them -17.6%, and a worst three-year stretch of -4.8% a year.
Its worst drawdown came in 2022: down 9.9% from December 2021 to September 2022. That was a bear market driven by rising rates rather than a credit event, so Carrier's signal never fired, and the cushion half held roughly flat rather than rising. The classic 60/40 lost 21% over the same nine months.
The fast selloff at the end of 2018 came close. It came and went too quickly for Carrier's credit signal to react, and Lowkey fell 9.4% from its August 2018 high to its December low before getting back above that high by June 2019. In that one episode the classic 60/40 actually held up a little better.
There will also be years when Lowkey simply lags. In 2012 it made just 4% while the classic 60/40 made 11%. In 2020 it made about 7% while the classic 60/40 made 16%. A portfolio built to avoid the big losses will sometimes give up part of the big gains. That is the trade.
How little it trades
This is the heart of it, so here is every month since 1997.
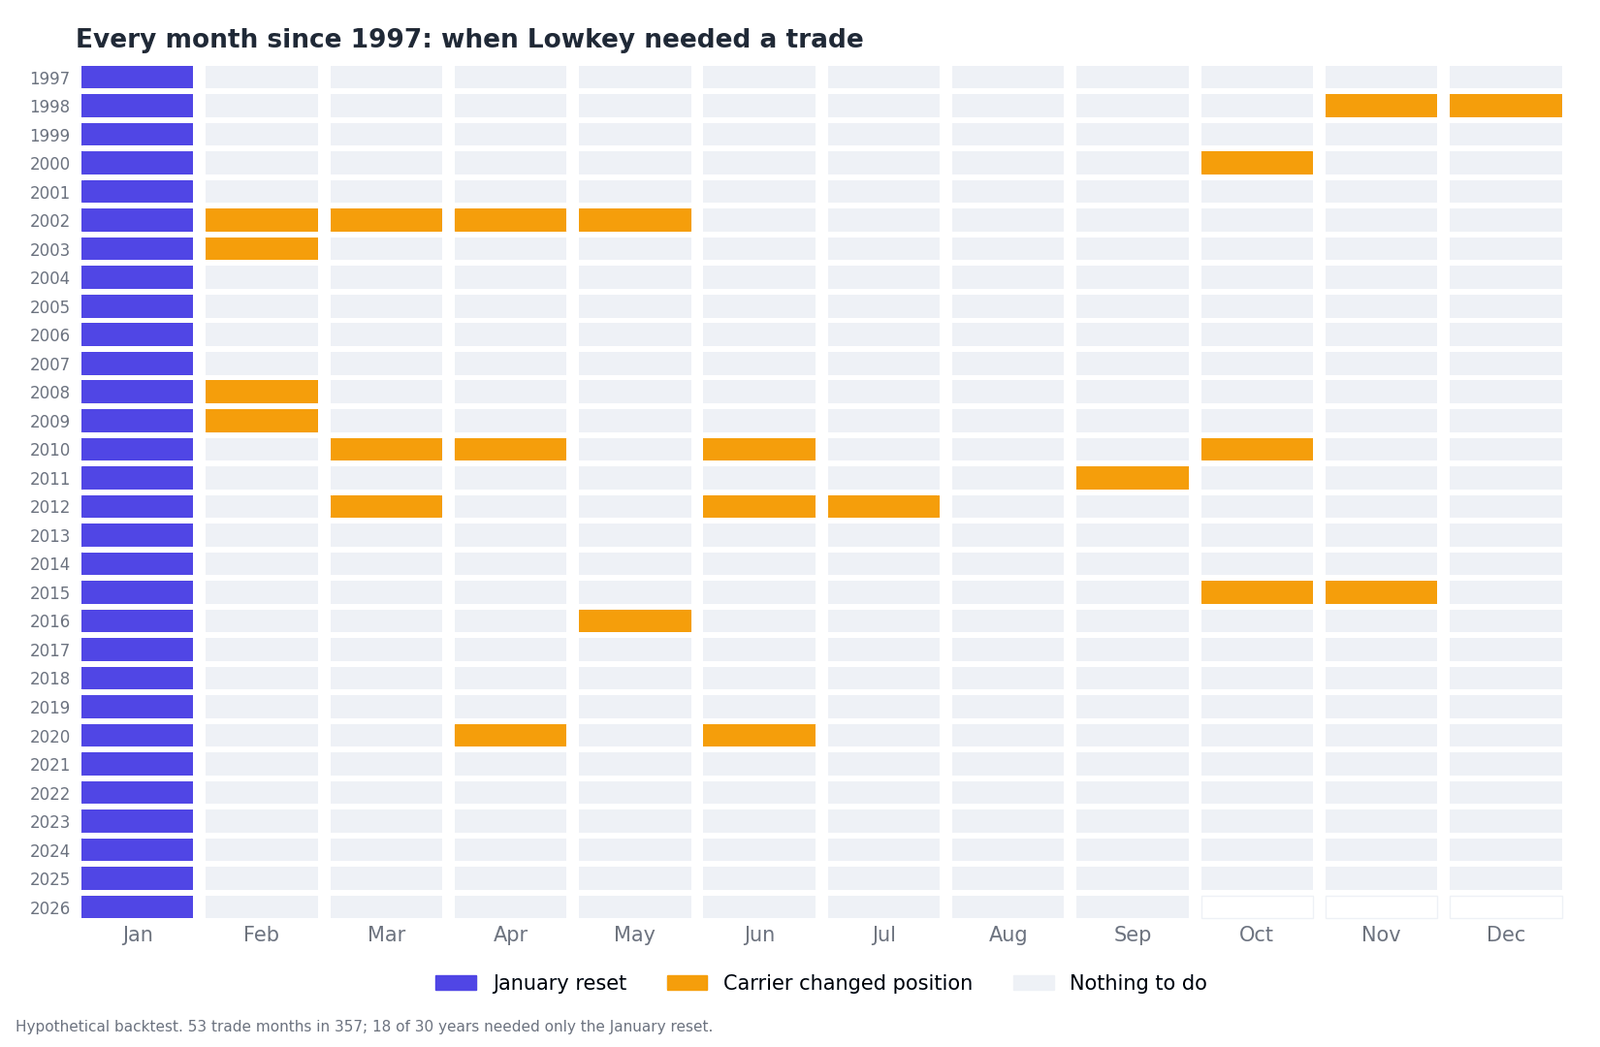
Each square is a month. Blue is the January reset. Orange is a month when Carrier changed position. Everything else is a month with nothing to do.
Out of 357 months, Lowkey needed a trade in 53 of them. That averages fewer than two trade months a year, and one of those is always January. In 18 of the 30 years, January was the only month anything happened at all. The last time Lowkey needed a trade outside of January was June 2020.
Those orange months cluster where you would expect them: 1998, 2000 to 2003, 2008 to 2009, 2010 to 2012, 2015 to 2016 and 2020, when credit markets were under real stress. In calm years there is simply nothing to do between one January and the next.
The January reset touches most of the holdings, since it brings the two strategies back to 50/50 and Permanent Portfolio DMS back to its four quadrant targets. A Carrier month moves the Carrier portion between its growth mix and Treasuries. Either way, it is a handful of trades in a handful of ETFs, typically five or six of them.
Who it is for
Lowkey is for the investor who:
- wants to stay invested and does not want to be told to rearrange things every month;
- would like protection from the major market declines, without having to watch for them;
- is happy with a good solid return rather than the highest possible one;
- wants no leverage;
- would rather follow one portfolio than two.
It is a poor fit if you want maximum growth and can sit through deep declines to get it. In that case Carrier on its own, or one of the leveraged versions, will compound faster. It is also a poor fit for money you will need soon, as is anything with stocks in it.
The honest caveats
- Backtests flatter everybody. I chose the two components and the 50/50 split with the benefit of hindsight. The split came from testing every mix from all Carrier to mostly Permanent Portfolio DMS, and 50/50 is where the worst drawdown came back under 10% while the return still stayed ahead of the S&P 500, but it was still chosen after the fact.
- Some history is reconstructed. Several of the funds involved, including DBMF, CLSE and CAOS, did not exist for the full period, and their early history uses proxy data.
- Fast selloffs are the weak spot. Carrier's credit signal confirms stress rather than predicting it, and the late-2018 episode shows what a fast decline can do before it reacts.
- Averages hide the order of events. Three decades of numbers say little about the particular sequence of good and bad years any one investor will live through.
Where to find it
The Lowkey page has the full details and the current allocation, and the pages for Carrier and Permanent Portfolio DMS go deeper on each half.
If you have been waiting for a DMS portfolio you can set up, check on now and then, and mostly leave alone, this is the one I built for you.
Past performance, including backtested results, is not indicative of future results. Backtested performance is hypothetical, does not reflect actual trading, and benefits from hindsight in the selection of strategy rules and component weights. Portions of the history rely on reconstructed proxy data for funds that did not exist for the full period. Investors should carefully consider their risk tolerance and consult with a financial advisor.