Introducing Carrier: A Credit-Regime Strategy Built for Long-Term Gains
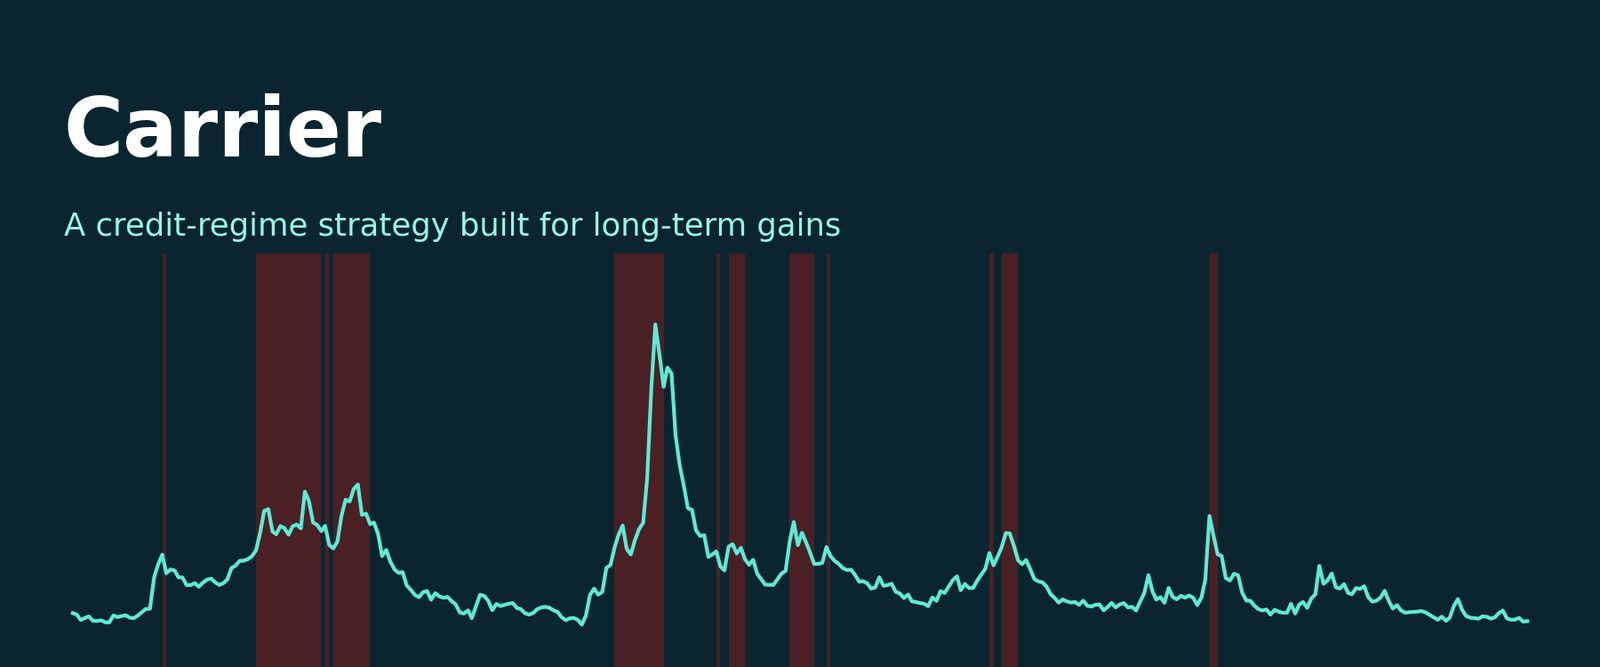
UPDATE: The research behind Carrier is now a paper on SSRN: Stepping Aside Only When Credit Breaks: A High-Yield Spread Regime Filter for Equity Exposure. It covers the rule in full, tests it against trend, momentum and HAA benchmarks, and includes the robustness checks, the 2022 blind spot and the data sources behind the history.
As often happens, I was out on a mountain bike ride when an idea for DMS came into focus.
I had been thinking about LT Gain. LT Gain exists for one reason: to compound with as much of the gain as possible taxed at long-term rates. It does that by holding U.S. large cap for as long as its momentum beats cash, and stepping aside when it does not. A problem with using momentum (or autocorrelation) as the deciding factor for moving in or out of a broad market ETF is that it can whipsaw in choppy markets. Every flip is a sale, and a sale inside of twelve months is a short-term gain.
The question on the trail was simple. What if the Risk On or Off decision did not come from price momentum at all? What if it came from something that only moves when there is a real problem? When I later had time to build the idea into a strategy, I did not anticipate how well it was going to do.
The signal: the high yield credit spread
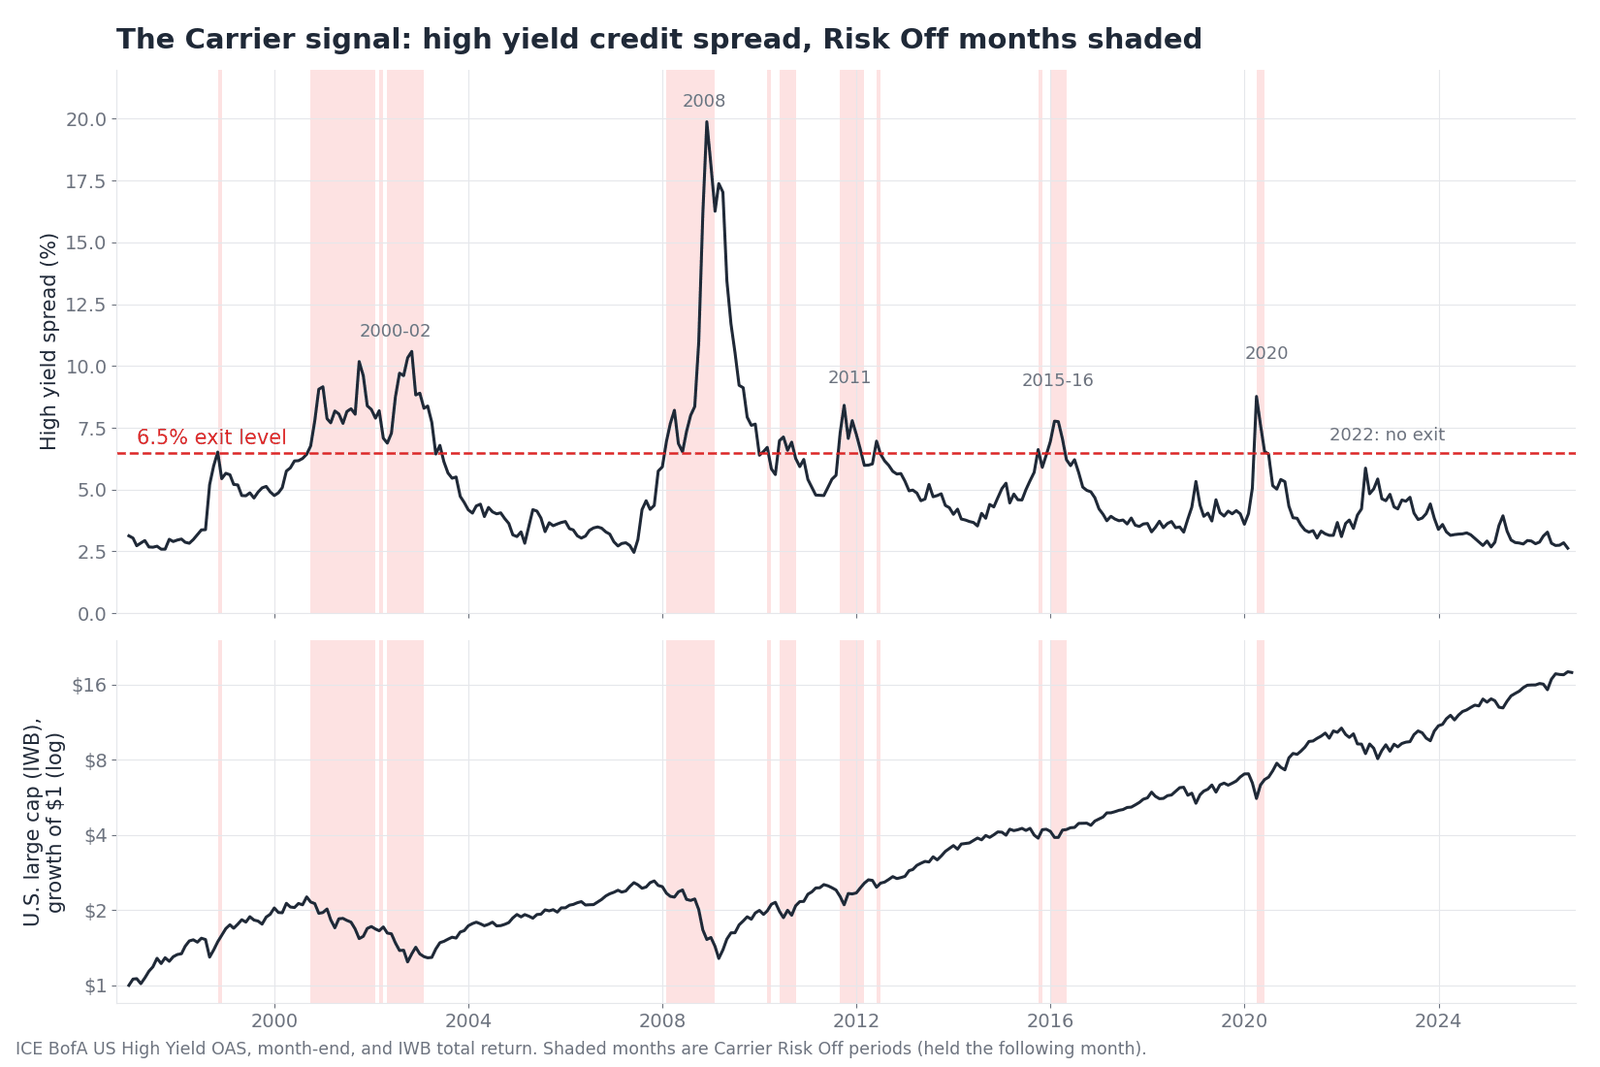
The high yield credit spread is the extra yield investors demand to hold below-investment-grade corporate bonds instead of Treasuries. In calm markets it sits around 3% to 4%. When lenders start to worry about defaults, recession or funding stress, it widens, and it widened sharply in every serious credit event of the last three decades.
Bond investors are paid to worry about getting their principal back, while equity investors can stay cheerful for a long time. When the people lending money to weaker companies start demanding a lot more to do it, that is worth taking note of.
This is the same idea behind Catalyst - using an external macro factor, inflation expectations, to decide where to be invested. Carrier uses credit instead.
How Carrier works
At each month end Carrier reads the high yield credit spread. It is Risk Off when the spread is at or above 6.5% and has not yet fallen 2 points below its highest reading of the last six months. Otherwise it is Risk On.
| Situation | Holding |
|---|---|
| Risk On | IWB 50% / QQQ 20% / DBMF 15% / CLSE 15% |
| Risk Off | IEF |
It rebalances when it changes position, each January, or when a holding drifts ten points from its target allocation. Otherwise it leaves things alone.
A few design choices are worth explaining.
The re-entry rule does most of the work. Stocks usually bottom while credit spreads are still high. A rule that waits for spreads to return to normal misses the best part of the recovery. Carrier gets back in once the spread has clearly turned, two points off its recent peak, even if it is still elevated. That rule got Carrier back into the market in February 2003 and February 2009, in both cases with spreads still above 8%.
The 6.5% level is the middle of a plateau, not the top of a peak. I tested every exit level from 4% to 9%. Anywhere from about 5.5% to 7.5% worked similarly. Below 5% the strategy whipsaws, because spreads of 5% to 7% were ordinary through much of the 2000s. Above 7.75% it reacts too late in 2008. I picked the middle.
The defensive side is plain intermediate Treasuries. I tested extended-duration Treasuries (EDV) for the first defensive month, the way LT Gain does it. It added a little return, but it deepened Carrier's worst drawdown by about four points, mostly from March 2002, when EDV fell 8% at the start of a Risk Off run. The drawdown isn't worth the slight improvement in CAGR so Carrier holds IEF for all Risk Off months.
The Risk On portfolio is diversified on purpose. The credit signal has a blind spot: a bear market that is not a credit event. 2022 was exactly that. Stocks and bonds fell together, the spread peaked at 5.87%, and Carrier never went Risk Off. The managed futures (DBMF) and long/short equity (CLSE) positions are there for that case. In 2022 they cut Carrier's drawdown by 8 to 10 points compared with an all-equity version.
The three versions
- Carrier, unleveraged.
- Carrier 170, which uses Smart Leverage to hold 2x S&P 500 (SSO) and 2x Nasdaq 100 (QLD) in place of IWB and QQQ during confirmed recoveries.
- Carrier 240, the same at 3x, with UPRO and TQQQ.
In both leveraged versions, only the U.S. large cap and Nasdaq 100 positions are ever leveraged. Managed futures, long/short equity and the Treasury holdings never are. That is why the numbers are 170 and 240 rather than 200 and 300.
Carrier vs LT Gain
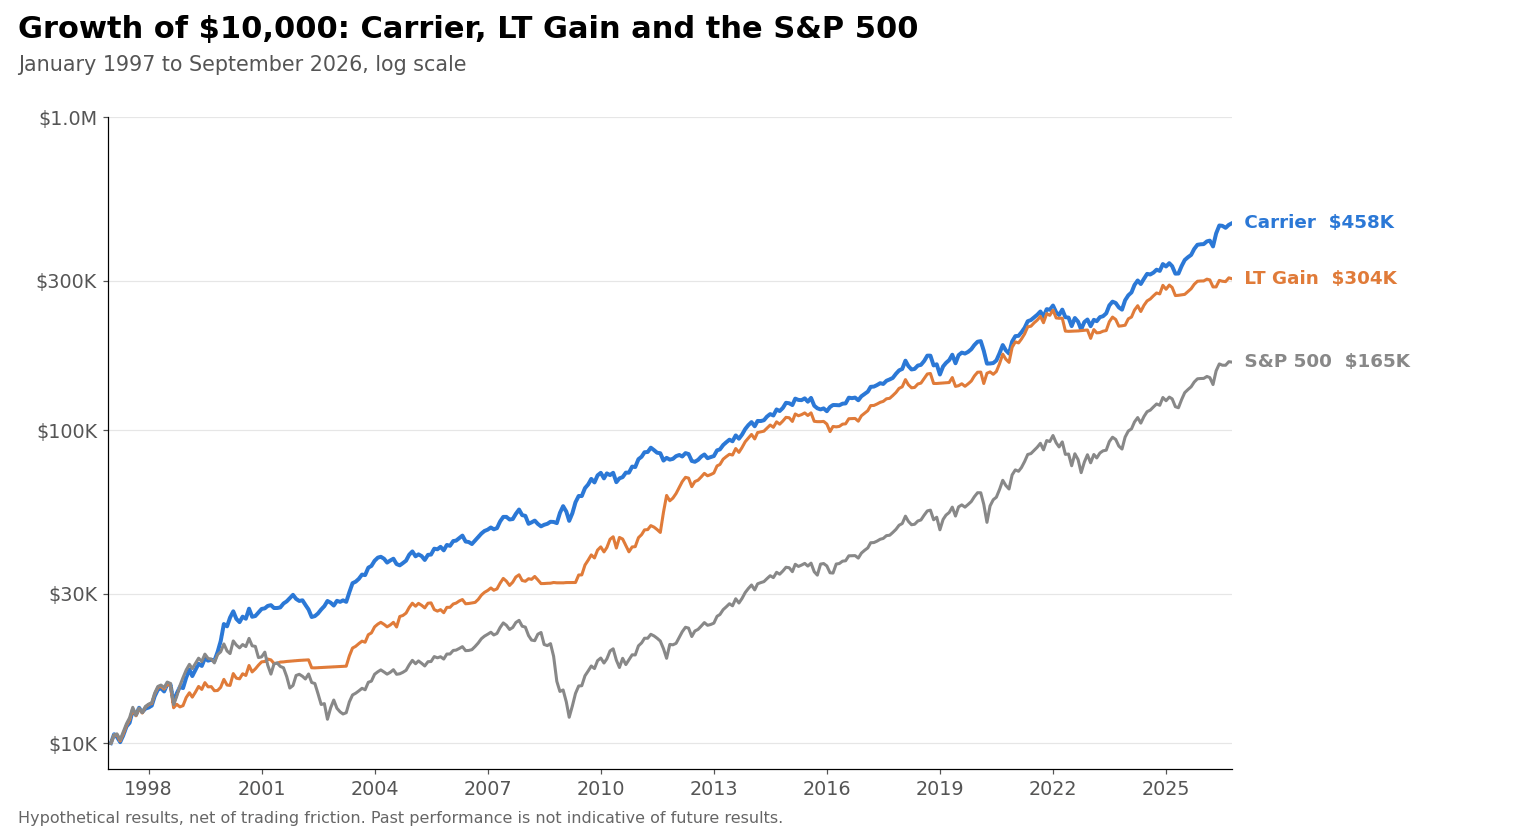
LT Gain is the right comparison, because both strategies were built with the same goal: strong risk-adjusted returns with most of the gains taxed at long-term rates.
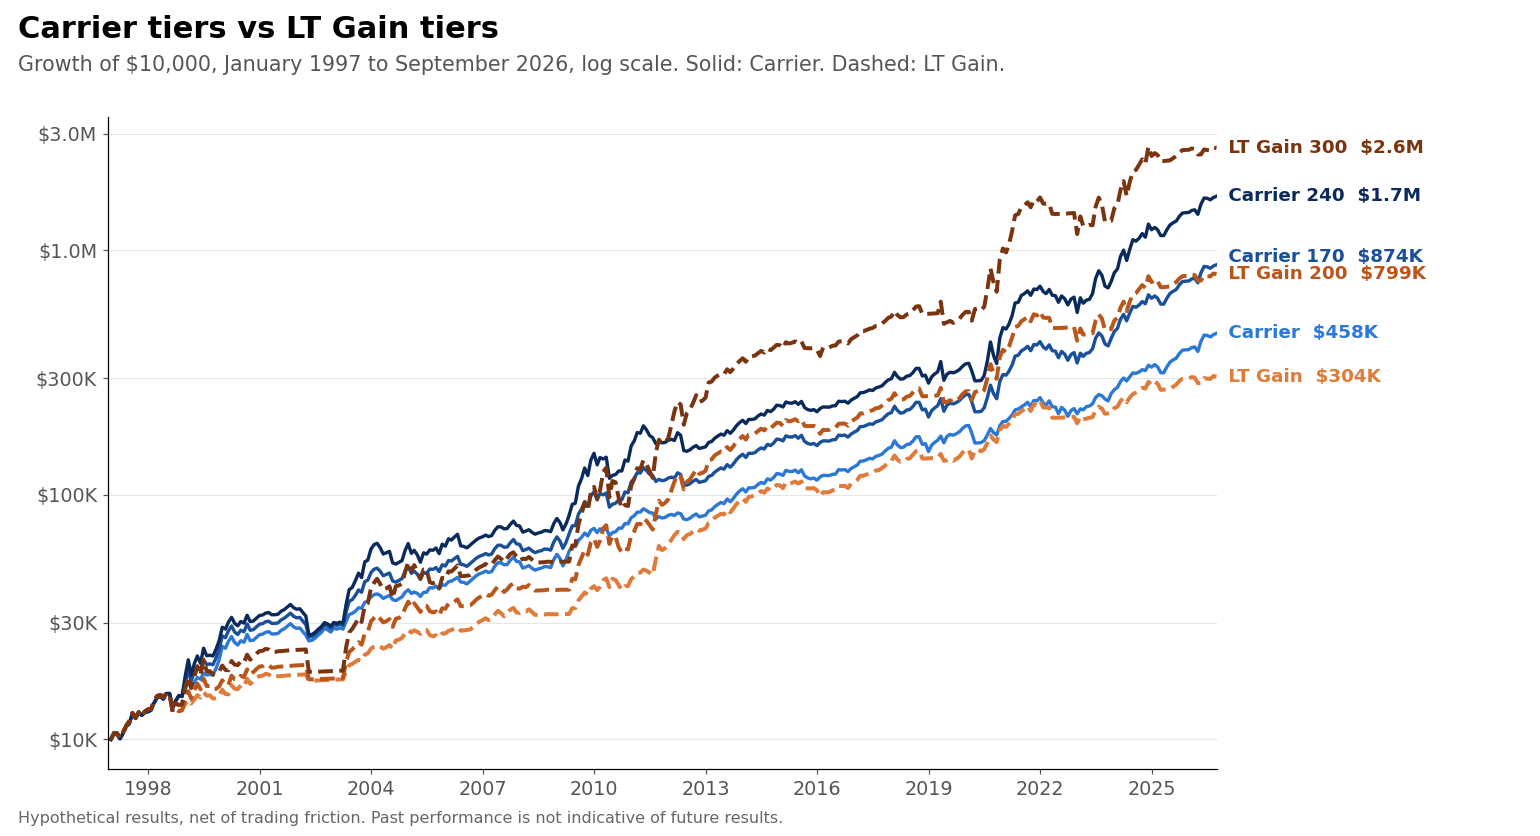
Every figure below runs January 1997 through September 2026, net of trading friction. The start date is where the high yield spread history begins.
| Strategy | LT gains % | CAGR | Max DD | Ulcer Index | UPI | After-tax CAGR |
|---|---|---|---|---|---|---|
| Carrier | 93% | 13.82% | -16.14% | 4.69 | 2.48 | 12.43% |
| LT Gain | 67% | 12.42% | -18.25% | 4.79 | 2.13 | 10.36% |
| Carrier 170 | 80% | 16.45% | -19.88% | 5.98 | 2.38 | 14.29% |
| LT Gain 200 | 74% | 16.24% | -23.53% | 6.45 | 2.18 | 13.81% |
| Carrier 240 | 81% | 19.04% | -24.63% | 7.87 | 2.14 | 16.61% |
| LT Gain 300 | 77% | 21.11% | -31.18% | 8.67 | 2.18 | 18.13% |
"LT gains %" is the share of realized gains from positions held more than a year. After-tax CAGR assumes an illustrative 24% short-term and 15% long-term rate. Better value in each pair is in bold, both when tied. The SSRN paper uses a stricter tax convention and reports a lower long-term share for the same strategy.
A few things stand out.
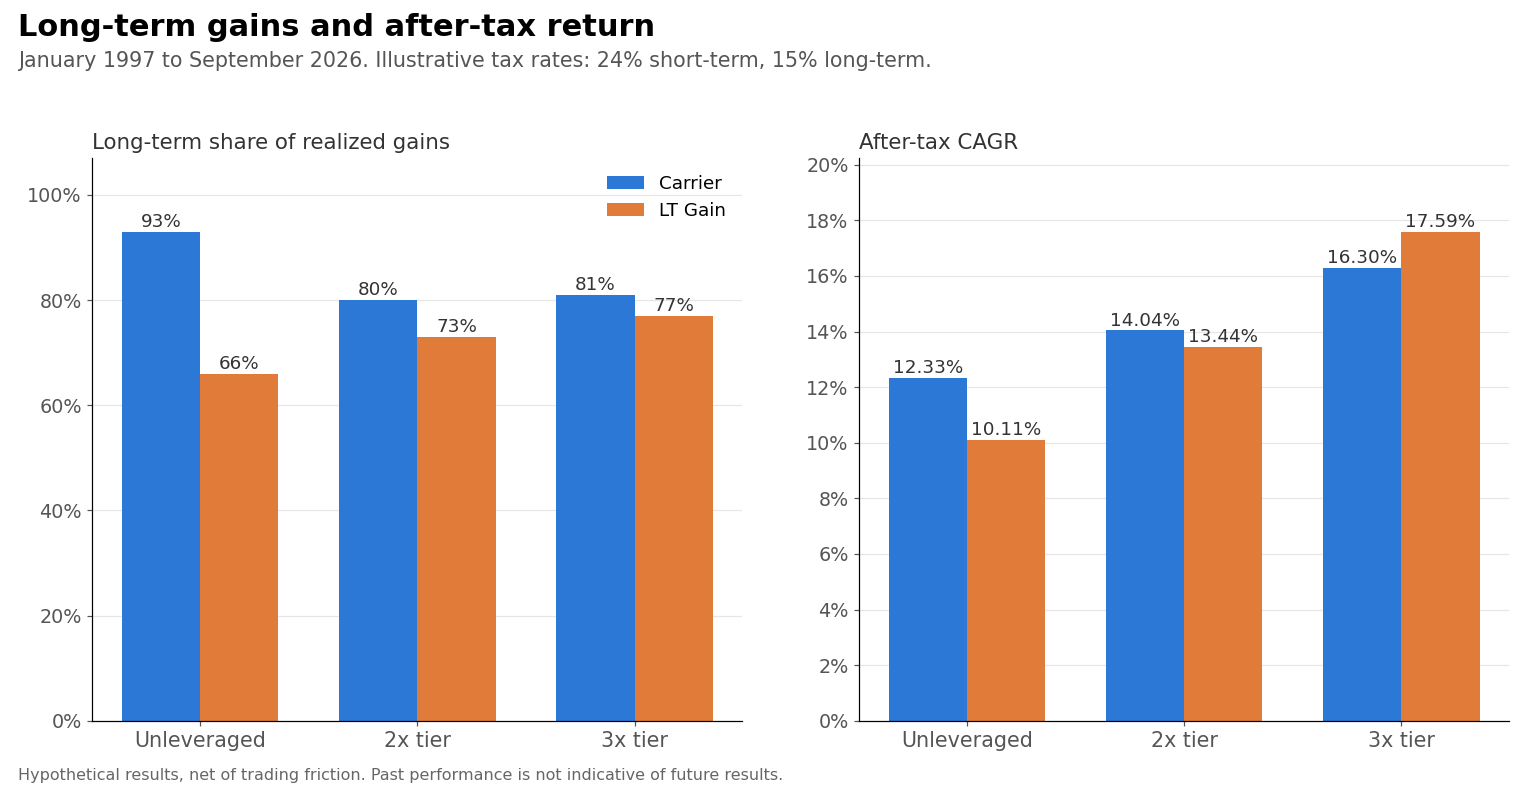
Carrier earns more of its gains at long-term rates than LT Gain does, at every tier. At the unleveraged level it is not close: 93% against 67%.
Carrier and Carrier 170 beat LT Gain and LT Gain 200 outright. Higher return, smaller drawdown, lower Ulcer Index, better UPI and better after-tax return, on every line of the table, and Carrier 170 does it with less maximum leverage than LT Gain 200.
Carrier 240 trades return for a much shallower drawdown. Its CAGR is about two points lower than LT Gain 300's, but it gets there with 240% maximum notional exposure instead of 300%, a maximum drawdown six and a half points shallower and a lower Ulcer Index. LT Gain 300's UPI is a touch higher, 2.18 to 2.14. If you want the most raw return in this family, LT Gain 300 has it. If the depth of the worst drawdown matters more to you, Carrier 240 is the easier one to hold.
Far fewer trades
This is where the tax advantage comes from. LT Gain switches between Risk On and Risk Off 1.6 times a year on average. Carrier does it 0.8 times a year, half as often.
Over the full record that is 48 switches for LT Gain and 24 for Carrier. Carrier was invested about 84% of the time, against about 73% for LT Gain. Carrier also trims back to target each January, but those are small rebalancing trades, not the full exits that generate large short-term gains.
The last two years
This is the stretch where the difference in approach showed up most plainly.
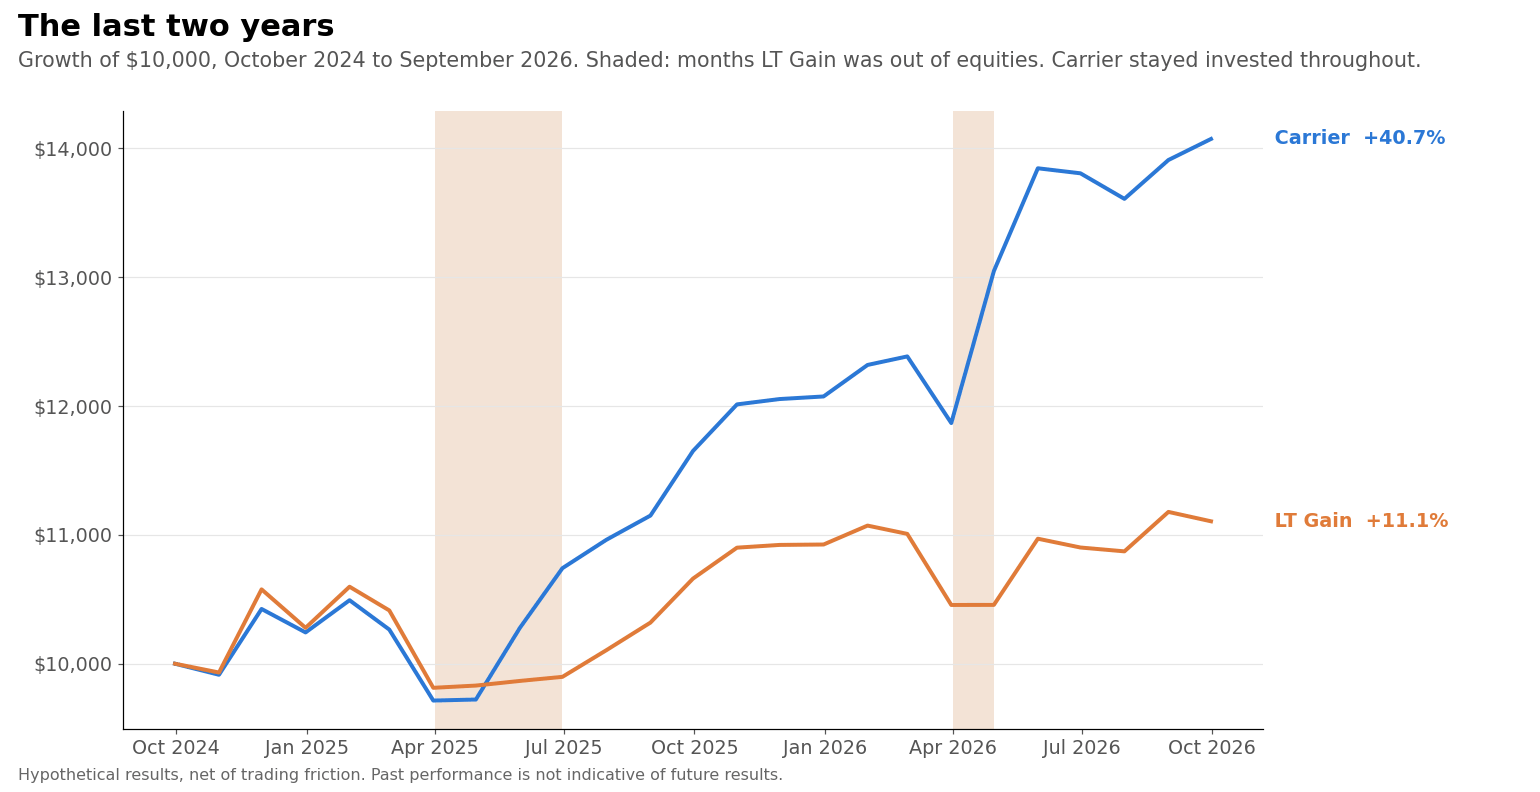
LT Gain has had a hard time since late 2024. The spring 2025 sell-off turned its momentum negative, and it spent April through June 2025 in short-term Treasuries while stocks rebounded. It happened again in April 2026, when it sat out a month in which Carrier gained almost 10%.
Carrier never moved in either episode. The credit spread peaked below 4% in 2025, nowhere near stress levels. The bond market was saying this was a stock market scare, not a credit problem, and it was right.
From October 2024 through September 2026, Carrier gained 40.7% against 11.7% for LT Gain. The leveraged versions tell the same story. Smart Leverage was only deployed for the first three months of the period, in both families, so the leveraged numbers are almost identical to the unleveraged ones.
Two good years do not make a strategy. But they show the mechanism working exactly as intended.
Drawdowns
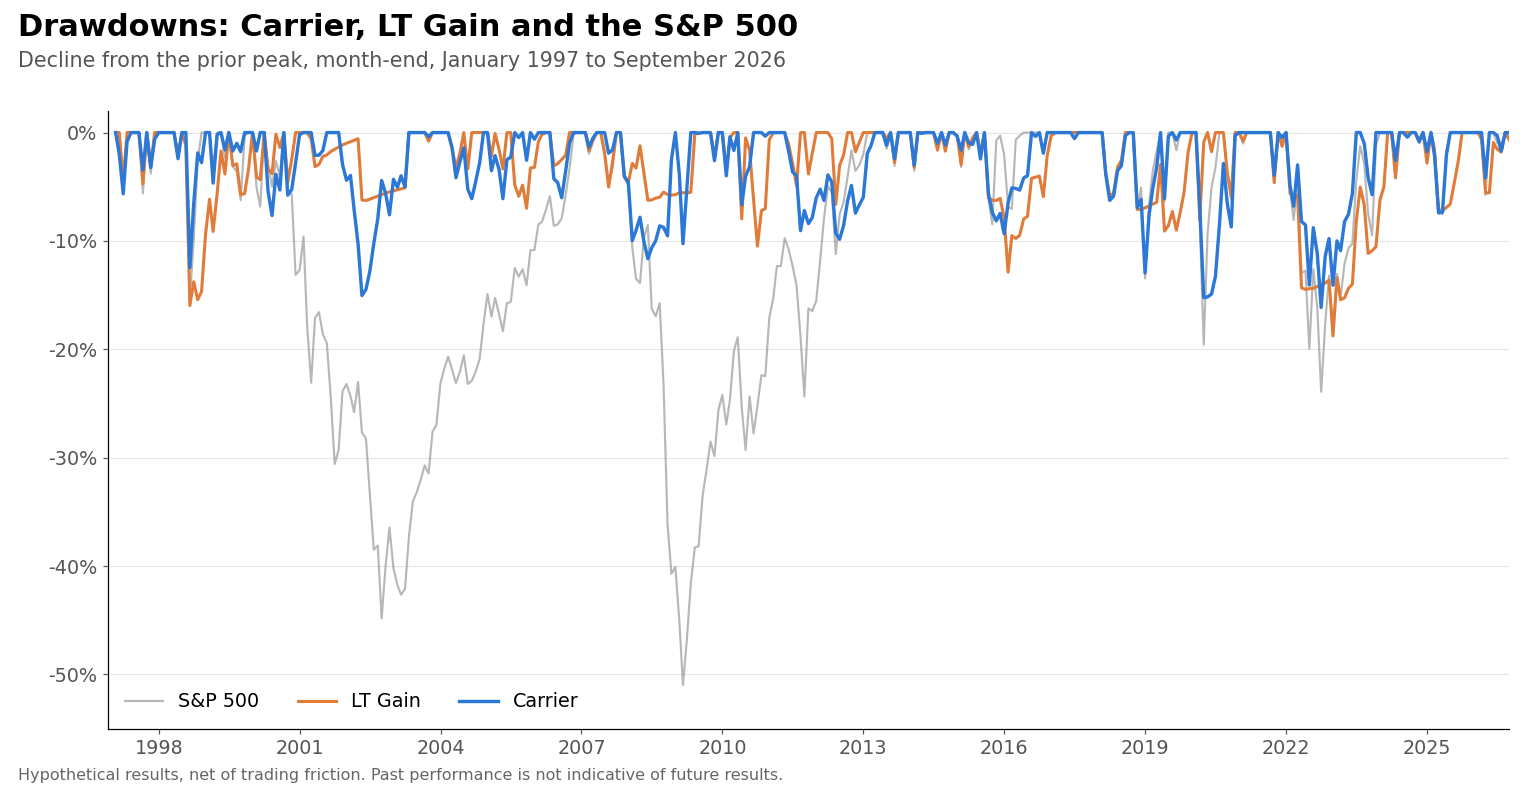
To be fair to LT Gain, it is the faster exit in a sudden crash. Momentum turns before credit spreads confirm, so LT Gain's drawdowns were shallower in 2000 to 2002, 2008 and 2020. In 2020, Carrier went Risk Off after the March crash and missed part of April's rebound. Carrier makes up for that by staying invested through the many scares that never turn into anything.
How Carrier compares to some of the other strategies
| Strategy | LT gains % | CAGR | Max DD | Ulcer Index | UPI | After-tax CAGR |
|---|---|---|---|---|---|---|
| Carrier | 93% | 13.82% | -16.14% | 4.69 | 2.48 | 12.43% |
| Carrier 170 | 80% | 16.45% | -19.88% | 5.98 | 2.38 | 14.29% |
| Carrier 240 | 81% | 19.04% | -24.63% | 7.87 | 2.14 | 16.61% |
| Global Navigator | 3% | 13.86% | -16.06% | 4.80 | 2.43 | 10.93% |
| Global Navigator 200 | 51% | 17.01% | -16.06% | 5.21 | 2.84 | 14.12% |
| Global Navigator 300 | 58% | 22.11% | -19.78% | 5.92 | 3.37 | 18.59% |
| Triad | 44% | 16.03% | -9.51% | 2.44 | 5.68 | 12.98% |
| Bold Asset Allocation Aggressive | 0% | 15.05% | -21.32% | 5.99 | 2.15 | 11.57% |
| S&P 500 | 100% | 9.88% | -50.97% | 15.11 | 0.51 | 9.88% |
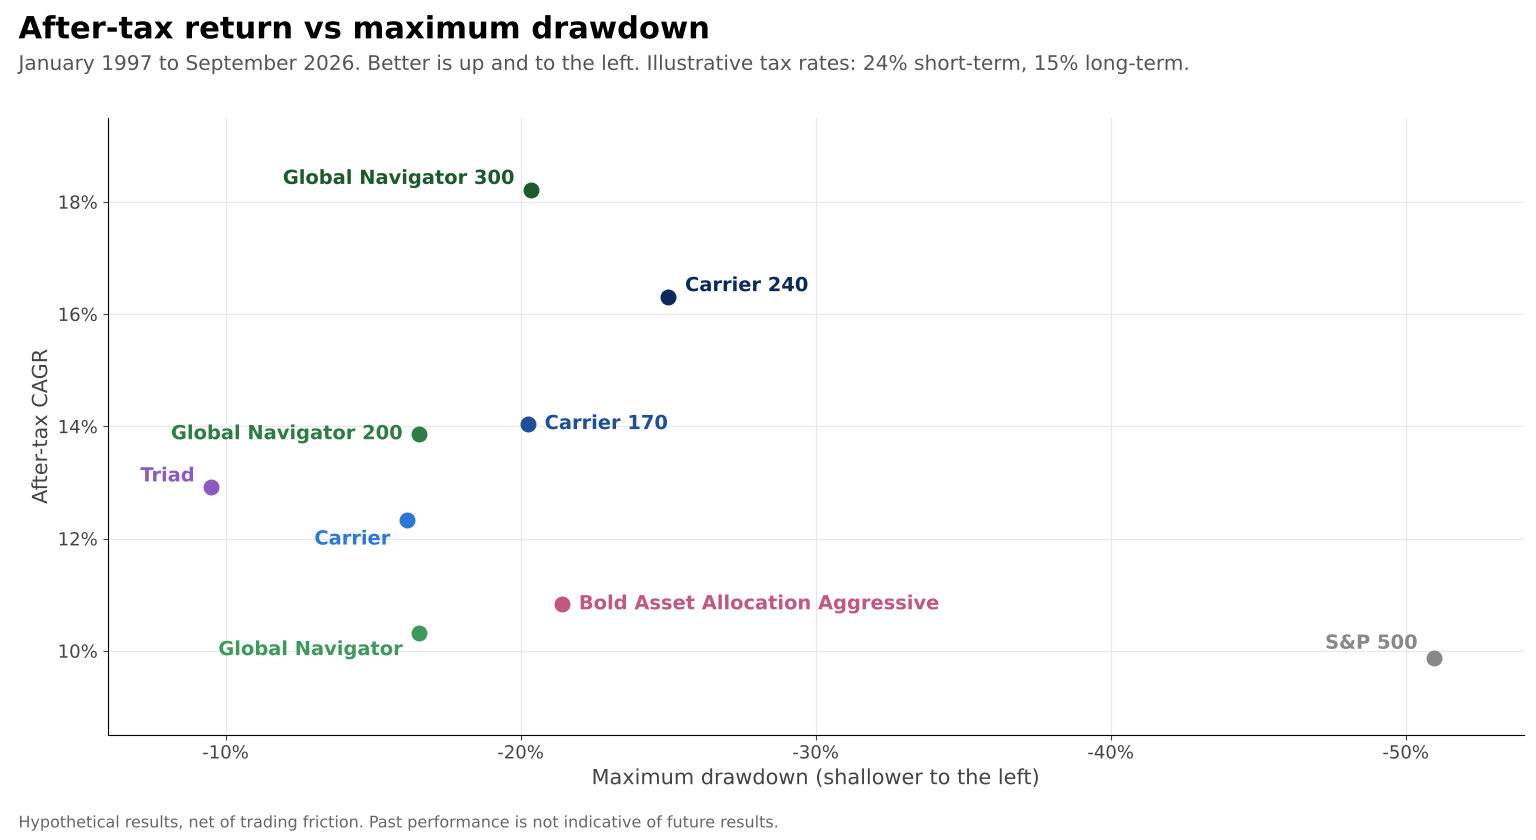
Global Navigator. Unleveraged, the two are nearly even before tax. Global Navigator is a hair ahead on return, 13.86% to 13.82%, and on maximum drawdown, -16.06% to -16.14%. Carrier has the lower Ulcer Index and the better UPI, and it earns 93% of its gains long-term against 3%, so it finishes well ahead after tax, 12.43% to 10.93%. At the 2x tier, Global Navigator 200 earns more before tax, 17.01% to 16.45%, and has the smaller drawdown and a better UPI. Carrier 170 still finishes ahead after tax, 14.29% to 14.12%, because 80% of its gains are long-term against 51%. At the top tier, Global Navigator 300 is the stronger strategy on return, after-tax return, drawdown and UPI. So Carrier wins the unleveraged comparison on risk and after tax, wins only after tax in the middle one, and loses the top one.
Bold Asset Allocation Aggressive. Carrier beats it on every line of the table except pre-tax return, where Bold Asset Allocation Aggressive is ahead, 15.05% to 13.82%. It is a monthly rotation strategy, so none of its gains are long-term, and its after-tax return falls to 11.57% against Carrier's 12.43%.
Triad. Triad remains the best risk-adjusted strategy I publish, by a wide margin. Its UPI is more than double Carrier's and its maximum drawdown is under 10%. Triad also trades much more often. From January 1997 through September 2026, Triad made trades in more than 180 different months, about six months out of every year. Carrier made trades in only 47 months, one or two months a year, and about half of those were just its regular January rebalance. Only 44% of Triad's gains are long-term, so taxes narrow the gap a lot, but Triad still finishes ahead after tax: 12.98% against 12.43% for Carrier. If your account is tax-deferred and you do not mind trading most months, Triad is the clear choice. If you would rather act a handful of times a year, Carrier is far easier to live with. In a taxable account the two are close, and they would sit well together, because they get out of the market for different reasons.
S&P 500. Every Carrier version beats the index by a wide margin, before and after tax, with a fraction of the drawdown.
What about LT Gain?
Carrier was built to replace LT Gain, and on the evidence above it does. I will leave the LT Gain strategies on the website for a while, so anyone following them has time to see Carrier's live signals alongside and make the move on their own schedule. After that, I will be removing them.
If you currently follow LT Gain in a taxable account, remember that switching creates a taxable event of its own. The cleanest time to move is when your LT Gain position is already changing, or when the gains you would realize are already long-term.
The honest caveats
- Two events do most of the work. Most of Carrier's edge over a fully invested version of its own portfolio came from 2000 to 2002 and 2008. It spent only about 16% of months Risk Off.
- It has a blind spot. A bear market that is not a credit event, like 2022, may not trigger an exit. Carrier lost 14% that year. Managed futures and long/short equity are the cushion.
- It is not a fast crash exit. Credit spreads confirm stress; they do not predict it.
- Some history is reconstructed. DBMF before 2019, CLSE before 2010 and the leveraged funds before their launches use proxy data. The 2022 benefit of the managed futures sleeve, when both funds were live, is real.
- Backtests flatter everybody. I chose the rules with the benefit of hindsight, as everyone does. Read these results as how the approach would have behaved, not as a forecast.
Where to find it
The strategy pages for Carrier, Carrier 170 and Carrier 240 have the full rules and history. Current allocations are on the site as usual.
When I finished building Carrier in September, the high yield spread was under 3%, a long way from 6.5%, and Carrier was fully Risk On.
Past performance, including backtested results, is not indicative of future results. Backtested performance is hypothetical, does not reflect actual trading, and benefits from hindsight in the selection of strategy rules. After-tax figures use illustrative tax rates and simplified assumptions, and your own tax situation will differ. Leveraged ETFs carry risks beyond those of their unleveraged counterparts. Investors should carefully consider their risk tolerance and consult with a financial advisor.