New Free Tool: Backtest Dual Momentum and ETF Rotation Back to 1980
What it does
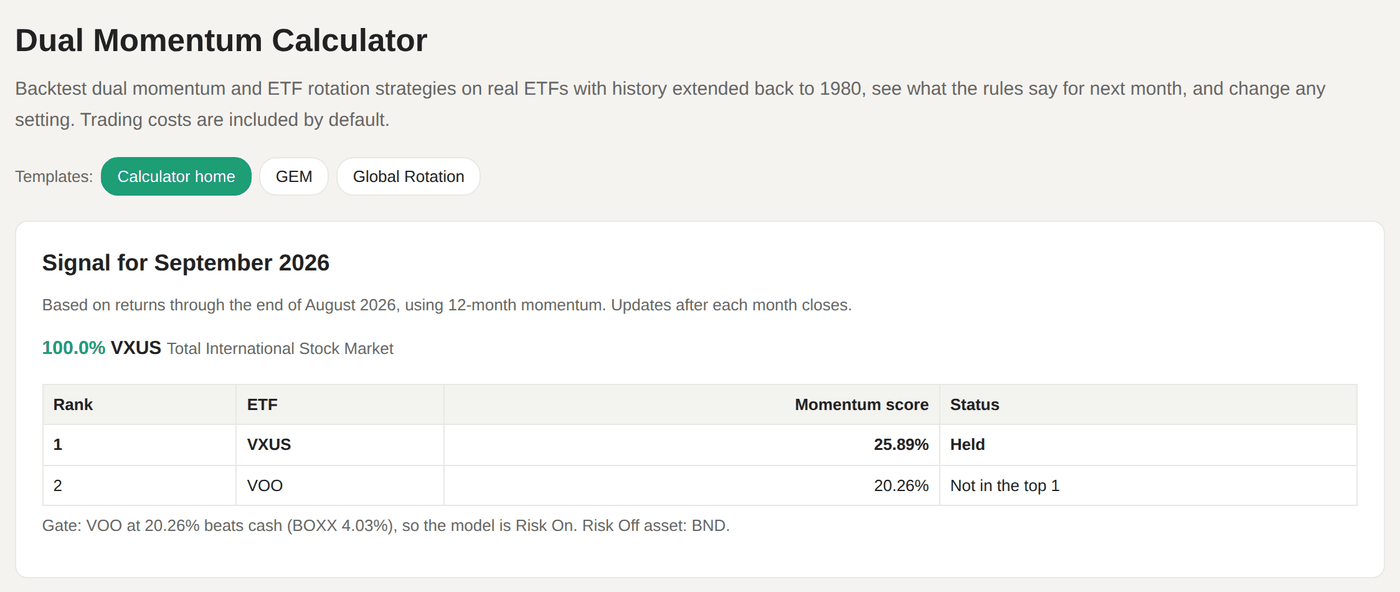
At its simplest, it answers the question most dual momentum followers ask at the start of every month: what do the rules say to hold? The top of the page shows next month's signal for whatever configuration you are looking at, with every candidate's momentum score, which one wins, and whether it clears the cash hurdle.
Below that is a full backtest. Change any setting and the results update immediately: growth of $10,000, drawdowns, CAGR, maximum drawdown, volatility, Sharpe, Sortino, Ulcer Index and UPI, a year-by-year table, and the last two years of allocations. You can download the monthly returns and allocations as CSV files, copy a share link that reproduces your exact setup, or send a summary by email.
Two templates to start from
GEM is the classic Global Equities Momentum model from Gary Antonacci. Each month it asks whether US stocks have beaten cash over the last 12 months. If not, it holds bonds. If they have, it holds whichever was stronger, US or international stocks. It is the model that made dual momentum famous, and it is the default when you open the calculator.
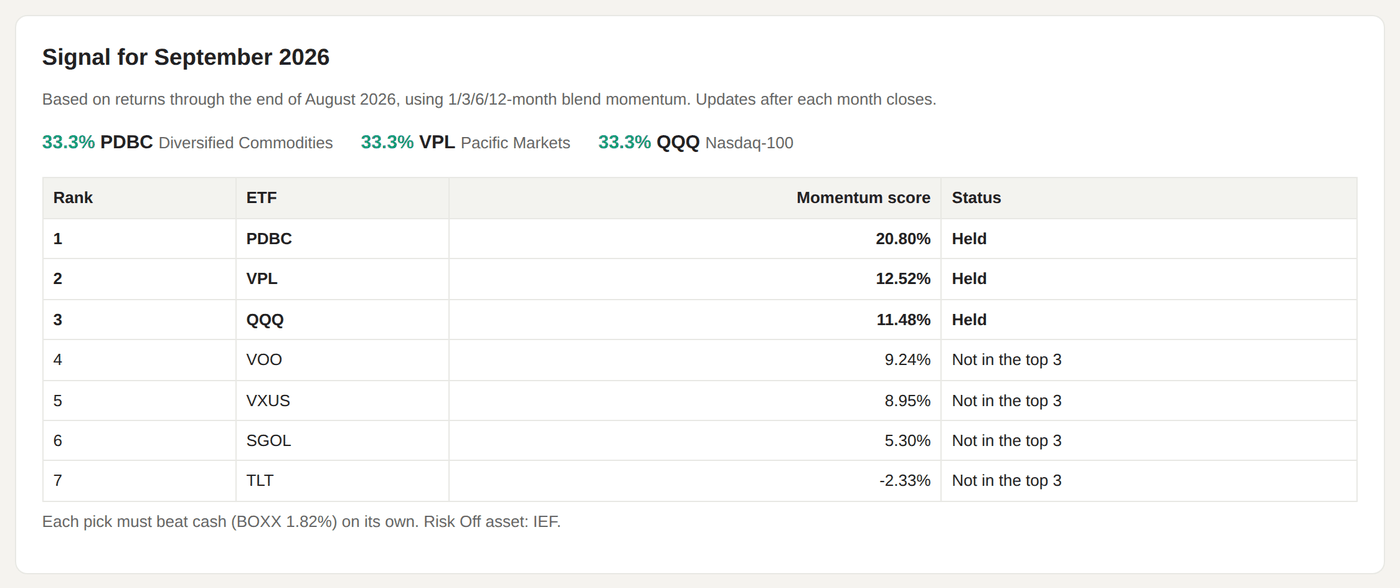
Global Rotation widens the field to seven ETFs across US stocks, the Nasdaq-100, international and Pacific stocks, gold, commodities and long Treasuries. It scores each one on a blend of its 1, 3, 6 and 12 month returns and holds the top three in equal thirds. Any pick that fails to beat cash on its own is swapped for intermediate Treasuries, so the portfolio can step down a third at a time rather than switching all at once.
Then change anything
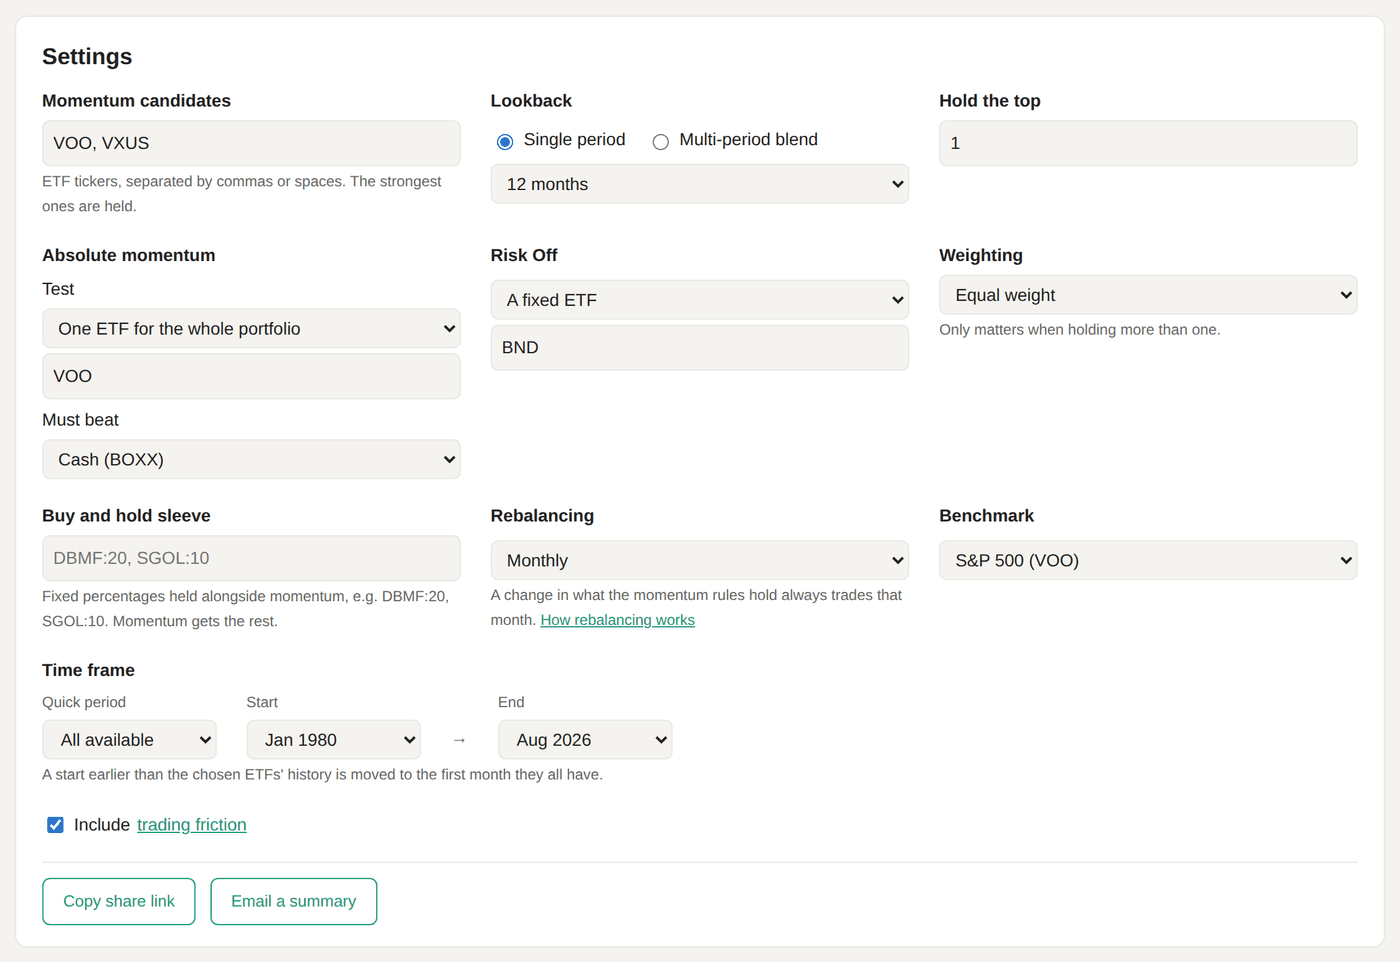
Every part of the rules is adjustable:
- Momentum candidates: any of the 70 ETFs in the calculator, typed with commas or spaces. A picker suggests tickers as you type, and you can search by name too, so typing "gold" finds SGOL.
- Lookback: a single period, or a blend of several with your own weights.
- Hold the top: one ETF like GEM, or several like a rotation.
- Absolute momentum: test each pick against the hurdle on its own, or use one ETF (like VOO in GEM) to decide Risk On or Risk Off for the whole portfolio. The hurdle is cash or zero.
- Risk Off: a fixed ETF, or the strongest of a basket of bond funds, with the option to fall back to cash when none of them is beating it.
- Weighting: equal weight, or equal risk, which gives the calmer holdings a bigger share.
- Buy and hold sleeve: keep a fixed slice outside the momentum rules. More on this below.
- Rebalancing: monthly, once a year, or drift bands.
- Benchmark: the S&P 500, a 60/40, the same ETFs held equally without momentum, or any ETF you like.
- Time frame: the same Quick period and Start/End pickers used across the rest of the site.
History back to 1980
Most dual momentum backtests you will find online start when the ETFs launched, which usually means the mid-2000s. That leaves out the 1987 crash, the 2000 to 2002 bear market and, for many funds, 2008. Those are exactly the periods where absolute momentum earns its keep.
The histories in the calculator are extended back to 1980 using the indexes and funds each ETF tracks, the same extended returns the strategies here are built on. Here is GEM from January 1980 through August 2026:
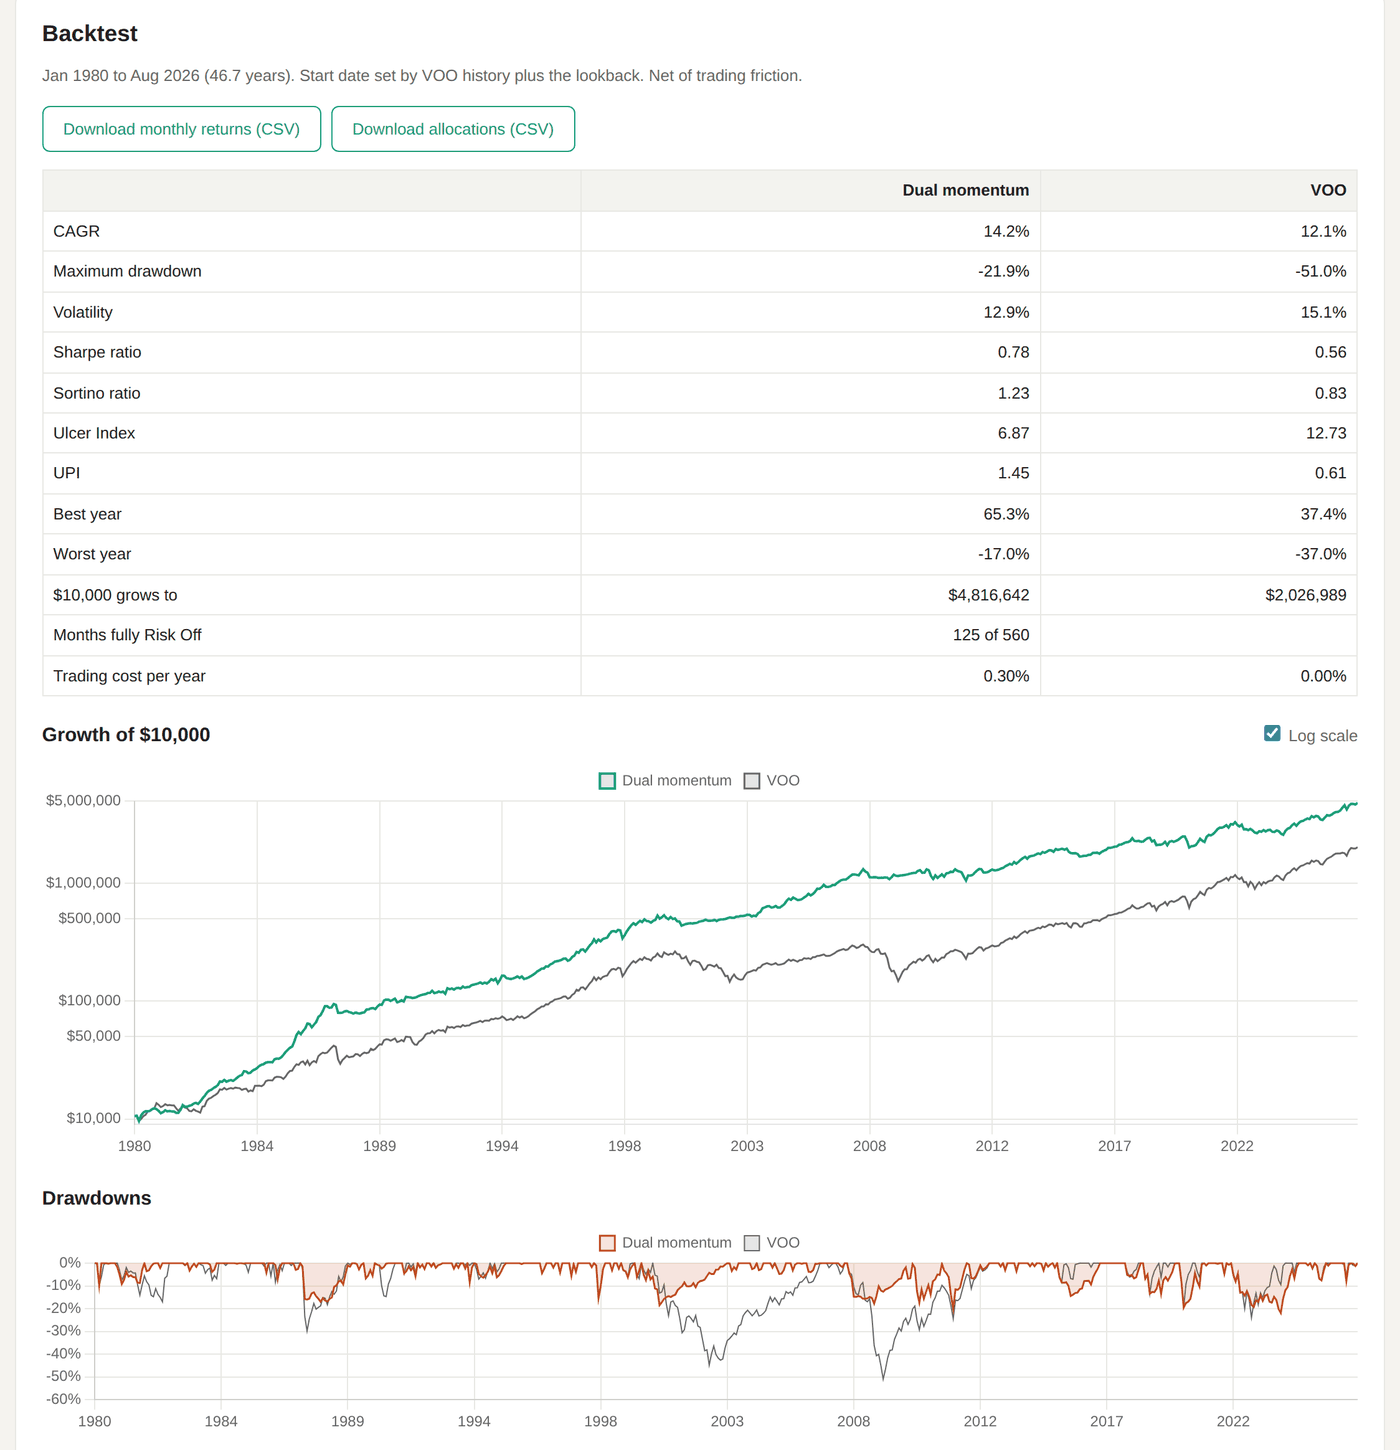
A 14.2% CAGR against 12.1% for VOO is nice, but the drawdown chart is the real story: a worst decline of 21.9% against 51.0% for the S&P 500. Look at what happens in the two big bear markets:
| Period | GEM | Global Rotation | S&P 500 (VOO) |
|---|---|---|---|
| Jan 2000 to Dec 2002 | -2.3% | +13.3% | -37.7% |
| Nov 2007 to Mar 2009 | -11.6% | +10.4% | -46.7% |
| 2022 | -17.0% | -8.7% | -18.2% |
That last row is worth sitting with. In 2022, stocks and bonds fell together, so GEM's move to bonds did not help much. Global Rotation held up better because it had more places to go, including commodities, which were one of the few things rising that year. No rule set wins every year, and the calculator makes it easy to find the years where yours would have hurt.
The buy and hold sleeve
This is the feature I have not seen done well elsewhere. Plenty of investors like the idea of dual momentum but do not want every dollar riding on one signal. The sleeve lets you hold a fixed slice outside the momentum rules and let momentum run the rest.
For example, take Global Rotation and add 20% managed futures (DBMF) and 10% gold (SGOL). Momentum now manages the remaining 70%:
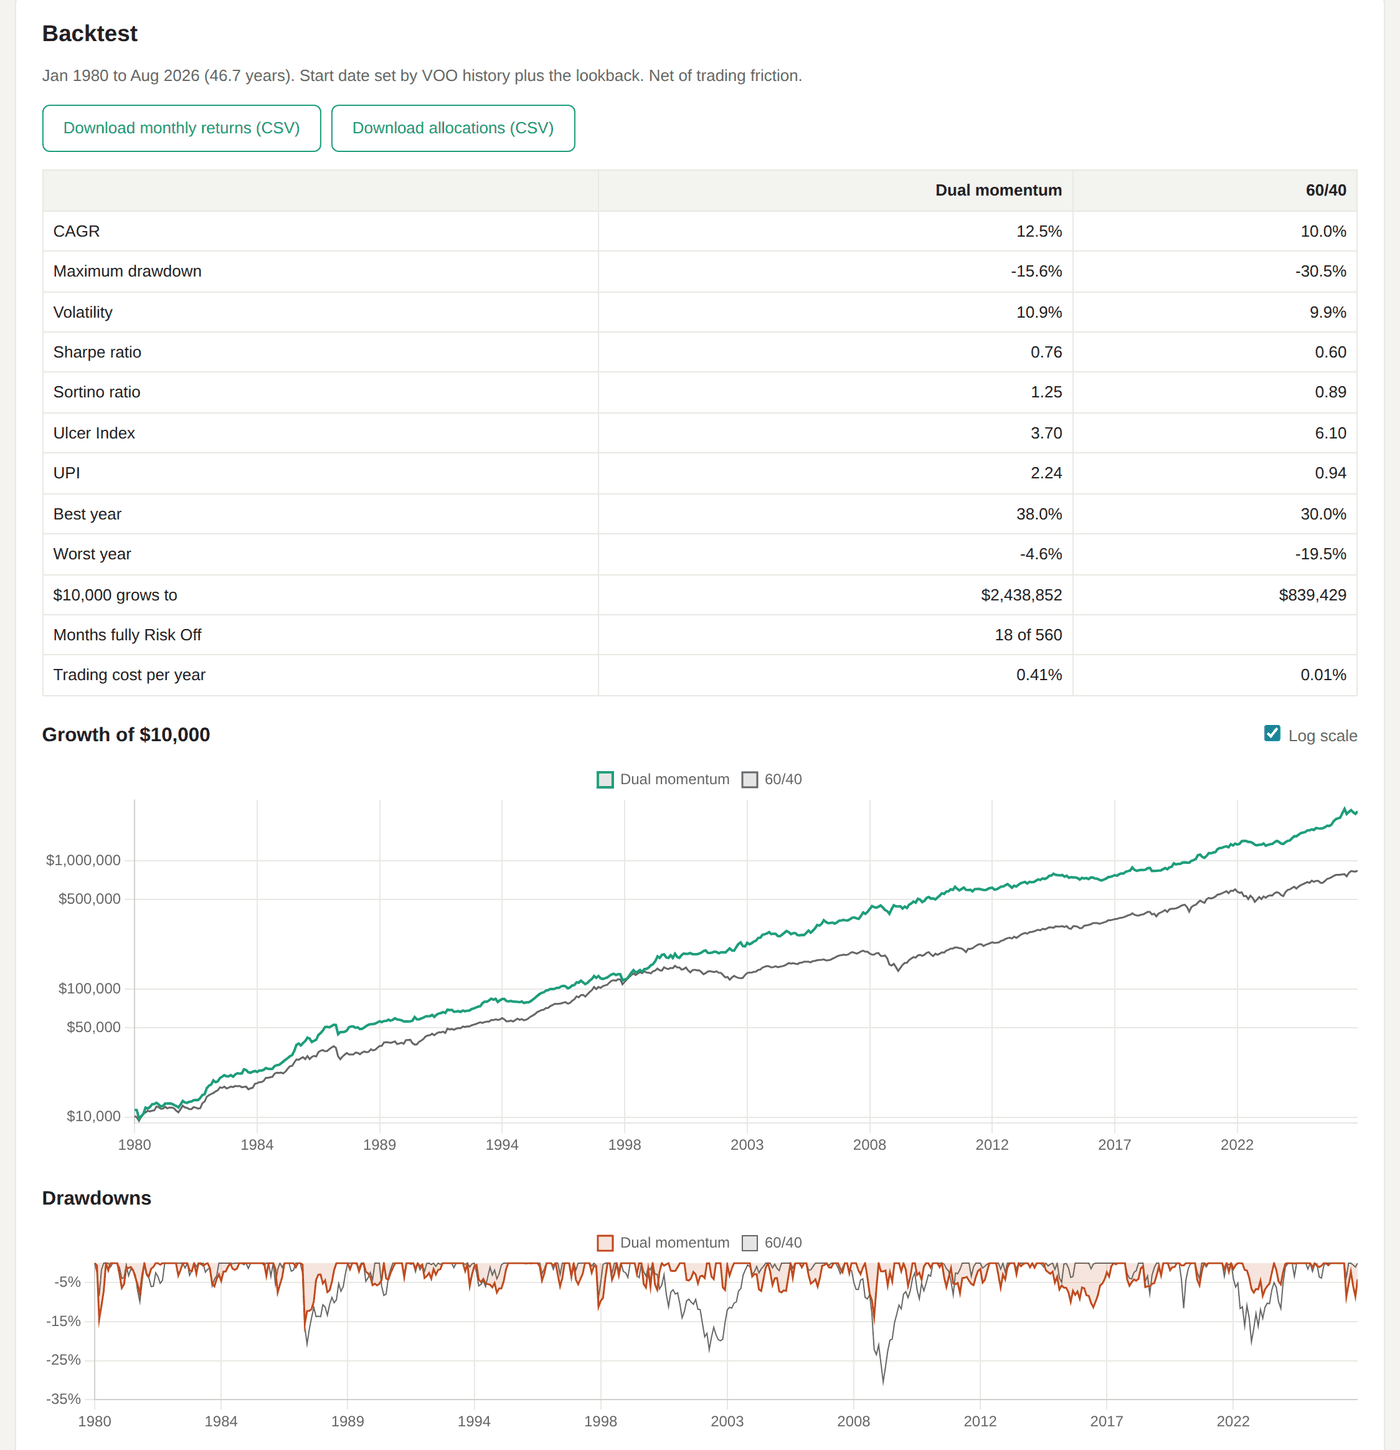
The CAGR drops from 14.2% to 12.5%, but the worst drawdown falls from 22.1% to 15.6%, and the worst calendar year improves from -8.7% to -4.6%. Whether that trade is worth it is your call, which is the whole point. You can open that exact setup here and keep changing it.
Honest numbers
Trading friction is on by default, using the same friction model as every strategy on this site. Every trade is charged, including the small ones that come from rebalancing back to target. For GEM it costs about 0.30% a year; switch it off and the CAGR rises from 14.2% to 14.5%. That gap is small for GEM because it trades rarely, but it grows quickly for faster rotations, and it is worth seeing before you decide a busier strategy is better.
The same goes for lookbacks. Switching GEM from a single 12 month lookback to a blend of 1, 3, 6 and 12 months lowers the worst drawdown from 21.9% to 18.8%, but also lowers the CAGR from 14.2% to 13.5% and raises the yearly trading cost from 0.30% to 0.49%. Faster is not automatically better. The calculator lets you see the trade-off instead of guessing.
Works on your phone
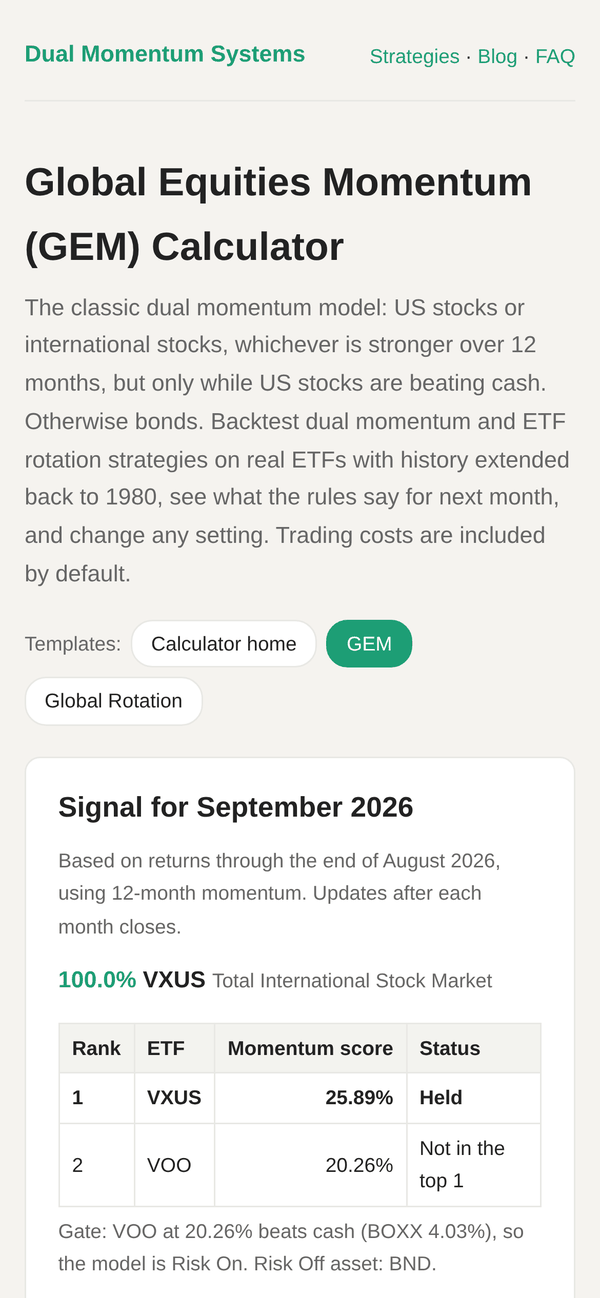
The calculator works on phones too, with the settings stacked above the results.
Where the strategies come in
The calculator is deliberately about dual momentum in its classic forms. The DMS strategies go further, with things like the Treasury Duration Limiter, smart leverage and credit spread signals, and they are tracked live every month. Global Rotation, for instance, is a simplified cousin of Global Navigator. If you find yourself building ever more elaborate rules in the calculator, that is probably a sign to look at what the strategies already do.
In the meantime, go play with it: dualmomentumsystems.com/dual-momentum-calculator. If you build something interesting, the share link makes it easy to send to me, and I would like to see it.
Backtests are hypothetical and are not a promise of future results. Returns before each ETF's launch are estimates built from comparable indexes and funds. Figures above run from January 1980 through August 2026 with trading friction included. This is educational and not investment advice.