Introducing Catalyst
Introducing Catalyst
I am really happy to introduce the Catalyst strategies.
Catalyst asks a different question than the rest of the lineup. Most tactical strategies rank assets against each other and hold whichever is winning. Catalyst asks what kind of economy we are in right now, and then holds the asset built for that environment. It uses four quadrants like a Permanent Portfolio, but instead of equal weighting all four, it concentrates into the one that fits.
Two axes
Growth is read from U.S. large-cap equities against their eight-month trend line. Above the line, growth is up. Below it, growth is down. It is a monthly measurement on purpose. A filter that can flip mid-month and flip back generates more trades and more false signals than one that can only change at month end.
Inflation is read directly out of the Treasury market, using the five-year breakeven rate. That is what investors collectively expect inflation to average over the next five years, priced continuously by people with money at risk.
Why the bond market instead of the Consumer Price Index? Because CPI arrives weeks late and describes what already happened. By the time a print confirms inflation is accelerating, the assets that benefit have usually already moved. I tested every backward-looking inflation measure I could get my hands on, and market-priced expectations beat all of them, some of them by a lot.
Catalyst asks two separate questions of that one rate:
- Is it above the Fed's 2% target?
- Is it higher than it was three months ago?
Keeping those separate matters more than it sounds. Inflation spends a lot of time in a state where the honest answer is "elevated, but no longer building." A single combined test forces an all-or-nothing call on that, and it gets it wrong in both directions: treat it as fully inflationary and you sit in energy long after the impulse fades, treat it as benign and you abandon energy on every wobble inside an intact regime.
So Catalyst treats it as its own state and splits the allocation.
What it holds
| Growth | Inflation | Allocation | |
|---|---|---|---|
| Level | Direction | ||
| Up | Above 2% | Rising | XLE 100% |
| Up | Above 2% | Falling | XLE 50% / QQQ 50% |
| Up | Below 2% | either | QQQ 100% |
| Down | Above 2% | Rising | SGOL 33% / PDBC 33% / DBMF 33% |
| Down | Above 2% | Falling | SGOL 17% / PDBC 17% / DBMF 17% / CAOS 50% |
| Down | Below 2% | either | CAOS 100% |
Energy when growth and inflation are both running. Technology when growth is intact and inflation is quiet. When growth rolls over with inflation still elevated, a three-way sleeve of gold, commodities and managed futures, which are close to uncorrelated with each other in those months and, in the case of gold and managed futures, actually negatively correlated. And when both roll over, tail-risk convexity.
That last one is a real departure. Conventional versions of this framework retreat to consumer staples and Treasuries in the defensive corner. In my testing, long-duration Treasuries were the single worst place to be in exactly those months, which is why they are nowhere in this strategy.
The two split states are not a hedge for its own sake. They run about a fifth of all months, so they are a working part of the strategy rather than a rare edge case.
Drift
Allocations are not reset every month. Between regime changes the holdings drift with the market, and Catalyst only rebalances when a position moves more than ten percentage points from its target, or when the regime itself changes and a different sleeve is called for.
So a 50/50 energy and technology position that runs to 55/45 is left alone. One that reaches 61/39 is reset. The effect on returns is immaterial either way, but it avoids trades that exist only because the calendar turned over, and fewer trades is worth something in a taxable account.
The practical consequence is that the published allocation for a given month will not always be exactly 50/50, or exactly a third each. That is intended, not a rounding error.
The circuit breaker
The growth axis watches large-cap equities, not the asset Catalyst happens to be holding. That is deliberate, since large caps are the cleanest read on the growth cycle, but it leaves a gap. If energy fell apart for reasons unrelated to the macro regime, the strategy's own signals would not notice.
While holding energy outright, if the position falls 15% from its high for that stretch, Catalyst moves to the tail-risk hedge instead. It goes back to energy once the position recovers to within 10% of that high. The gap between the two levels is on purpose; a single threshold would flip in and out on small moves.
Two things I want to be straight about. It has never triggered. Across 23 years, the deepest decline energy has taken while held by this strategy is about 10%, so a 15% breaker would have sat dormant the whole time. Every number below is identical with and without it.
A tighter setting would have hurt. Every threshold I tested that does trigger exited near bottoms rather than ahead of declines, costing return without reducing drawdown. Energy pulls back frequently inside intact uptrends, and the macro regime has already filtered out the environments where it genuinely breaks down.
It is insurance against something that has not happened. That is what it is for.
The three variants
Catalyst is unleveraged.
Catalyst 200 and Catalyst 300 apply Smart Leverage to the technology position only, for up to 200% and 300% notional. It arms only after technology has already fallen meaningfully below its all-time high, deploys only once momentum has genuinely turned back up, and exits on a momentum reversal or a hard time limit set at the long-term capital gains boundary. Across the backtest it has been deployed in roughly a quarter of all months.
Leverage follows the technology position wherever it appears, including as half of a split state. Any move to a state without technology exits it entirely rather than carrying it into a different holding.
Results
Backtested from May 2003, when the five-year breakeven rate begins, through September 2026.
| CAGR | Max Drawdown | Ulcer Index | UPI | Sortino | |
|---|---|---|---|---|---|
| Catalyst | 24.65% | -14.41% | 4.43 | 5.56 | 2.47 |
| Catalyst 200 | 32.97% | -17.91% | 4.70 | 7.01 | 2.76 |
| Catalyst 300 | 41.19% | -27.21% | 5.62 | 7.33 | 2.73 |
| S&P 500 | 11.32% | -50.97% | 11.74 | 0.83 | 1.13 |
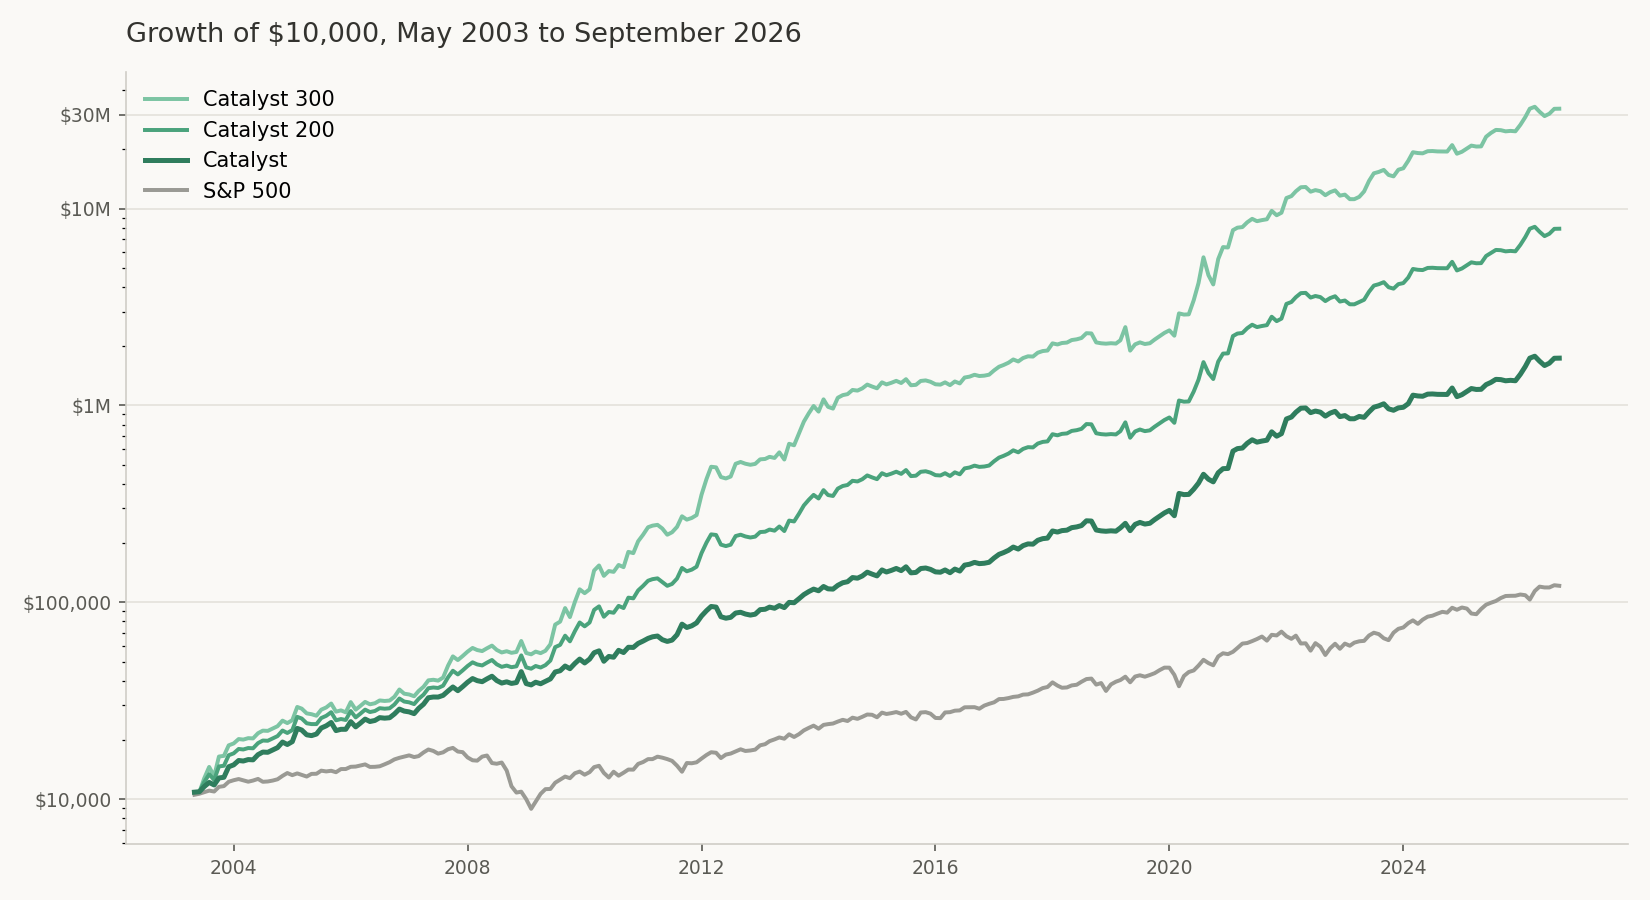
Ten thousand dollars became $1.74 million in Catalyst, $7.9 million in Catalyst 200 and $32.2 million in Catalyst 300, against $121,000 in the S&P 500.
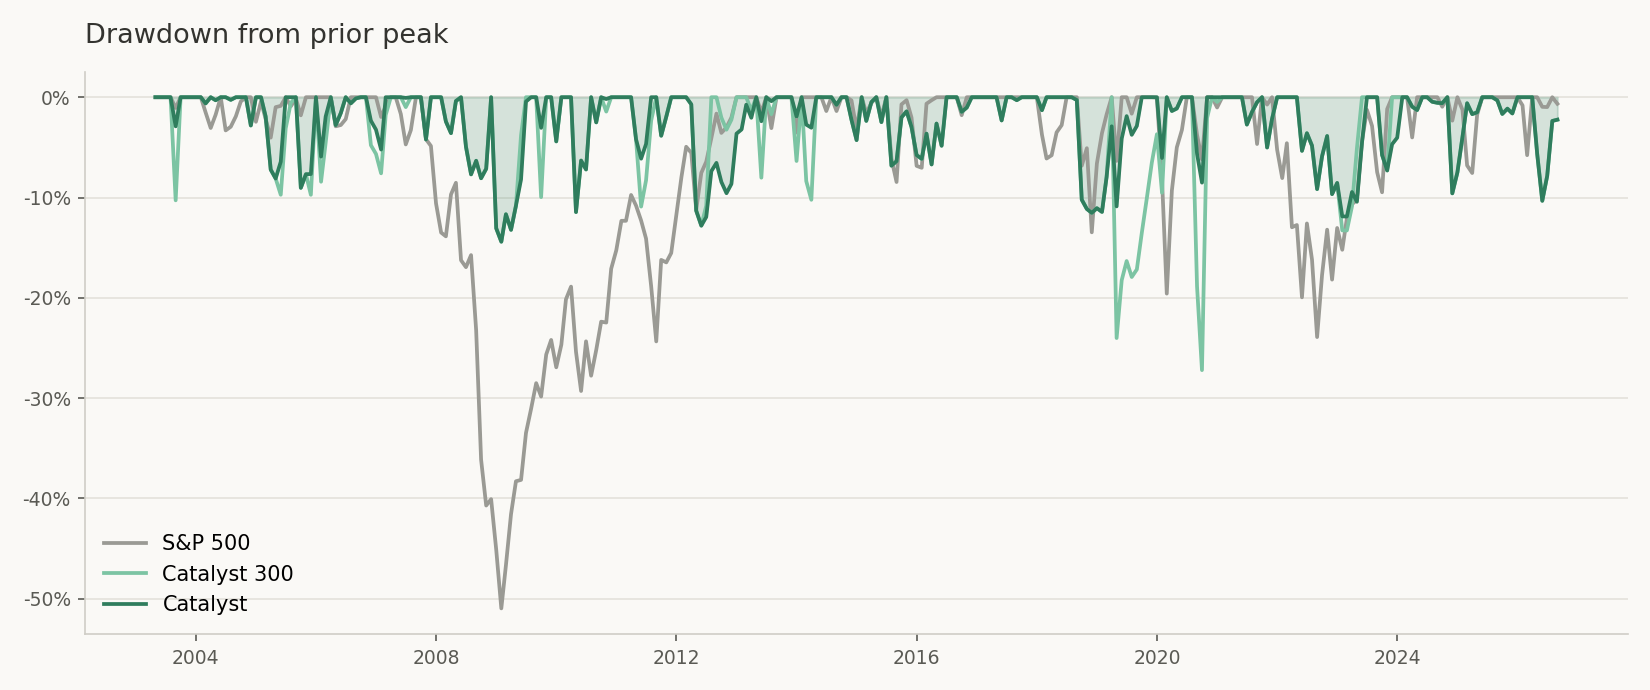
The drawdown chart is the one I would actually spend time on. The index spent most of 2008 and 2009 more than 40% underwater and touched -51%. Catalyst's worst was -14.4%.
Calendar years:
| Year | Catalyst | Catalyst 200 | Catalyst 300 | S&P 500 |
|---|---|---|---|---|
| 2003 | 46.1% | 67.2% | 87.7% | 22.6% |
| 2004 | 29.8% | 29.8% | 29.8% | 10.7% |
| 2005 | 19.5% | 16.4% | 13.4% | 4.8% |
| 2006 | 23.7% | 24.1% | 24.3% | 15.6% |
| 2007 | 33.1% | 43.9% | 55.3% | 5.4% |
| 2008 | 19.2% | 19.2% | 19.2% | -37.0% |
| 2009 | 15.8% | 47.0% | 83.1% | 26.5% |
| 2010 | 20.1% | 45.4% | 75.4% | 9.4% |
| 2011 | 27.1% | 32.0% | 35.9% | 1.9% |
| 2012 | 10.7% | 42.2% | 81.9% | 16.0% |
| 2013 | 34.1% | 62.9% | 96.9% | 32.4% |
| 2014 | 19.2% | 22.8% | 25.6% | 13.5% |
| 2015 | 5.7% | 5.7% | 5.7% | 1.3% |
| 2016 | 8.6% | 8.6% | 8.6% | 12.2% |
| 2017 | 32.7% | 32.7% | 32.7% | 21.8% |
| 2018 | 8.4% | 8.4% | 8.4% | -4.5% |
| 2019 | 23.9% | 18.5% | 13.4% | 31.4% |
| 2020 | 67.9% | 117.5% | 172.9% | 18.3% |
| 2021 | 50.6% | 50.5% | 49.5% | 28.8% |
| 2022 | 22.1% | 22.1% | 22.1% | -18.2% |
| 2023 | 10.8% | 22.6% | 35.5% | 26.3% |
| 2024 | 14.1% | 17.4% | 20.6% | 25.0% |
| 2025 | 20.4% | 25.1% | 30.0% | 17.8% |
| 2026 YTD | 30.3% | 30.3% | 30.3% | 12.4% |
2008 and 2022 are the years I would point at. Up 19.2% while the S&P lost 37%, and up 22.1% while it lost 18.2%. That is the four-quadrant structure doing what it exists to do.
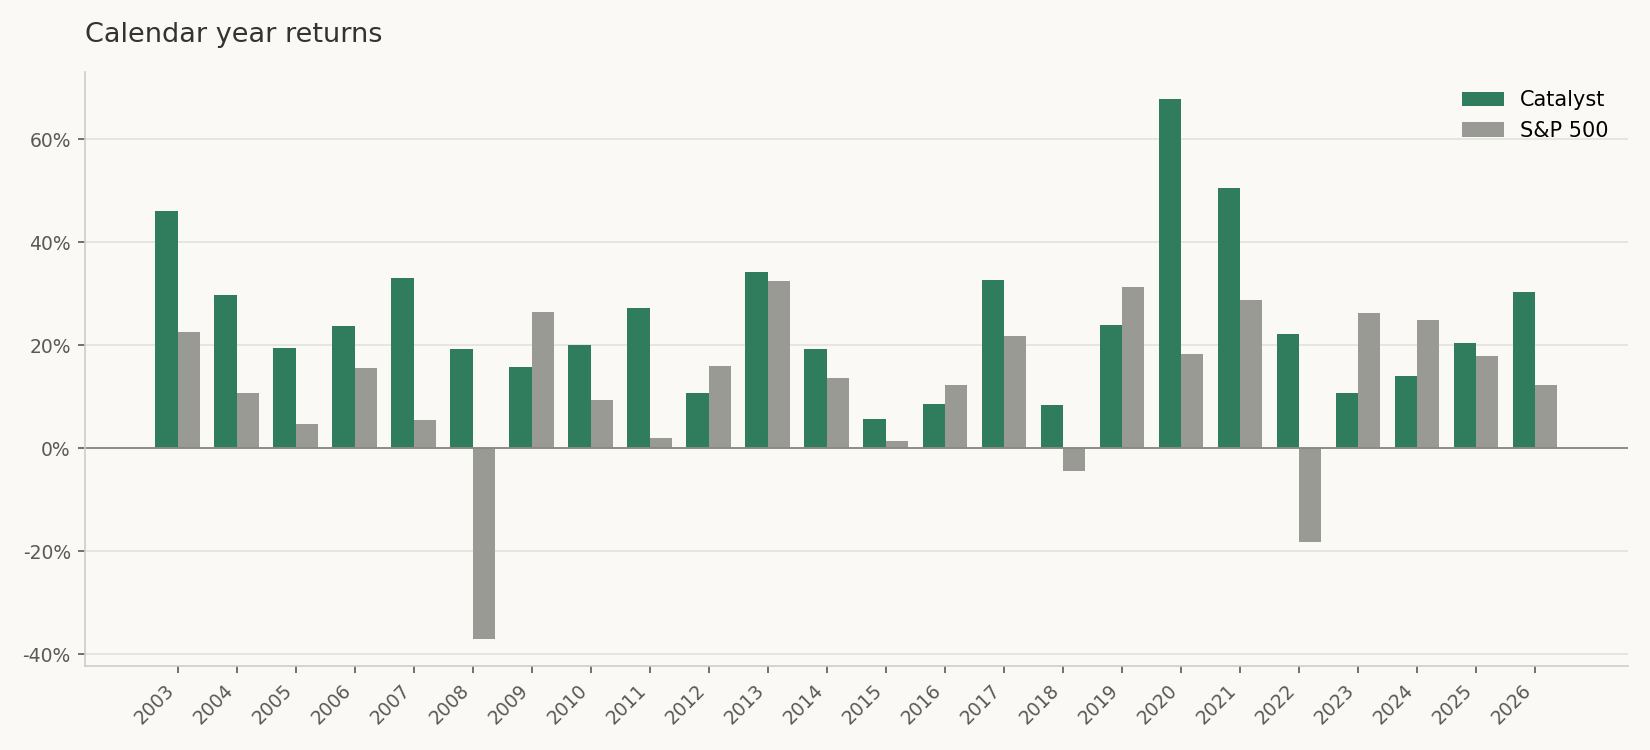
2016, 2019 and 2024 are the other side of it. Three years of trailing the index because the regime call kept Catalyst in the wrong place. That will happen again.
Where it has actually been
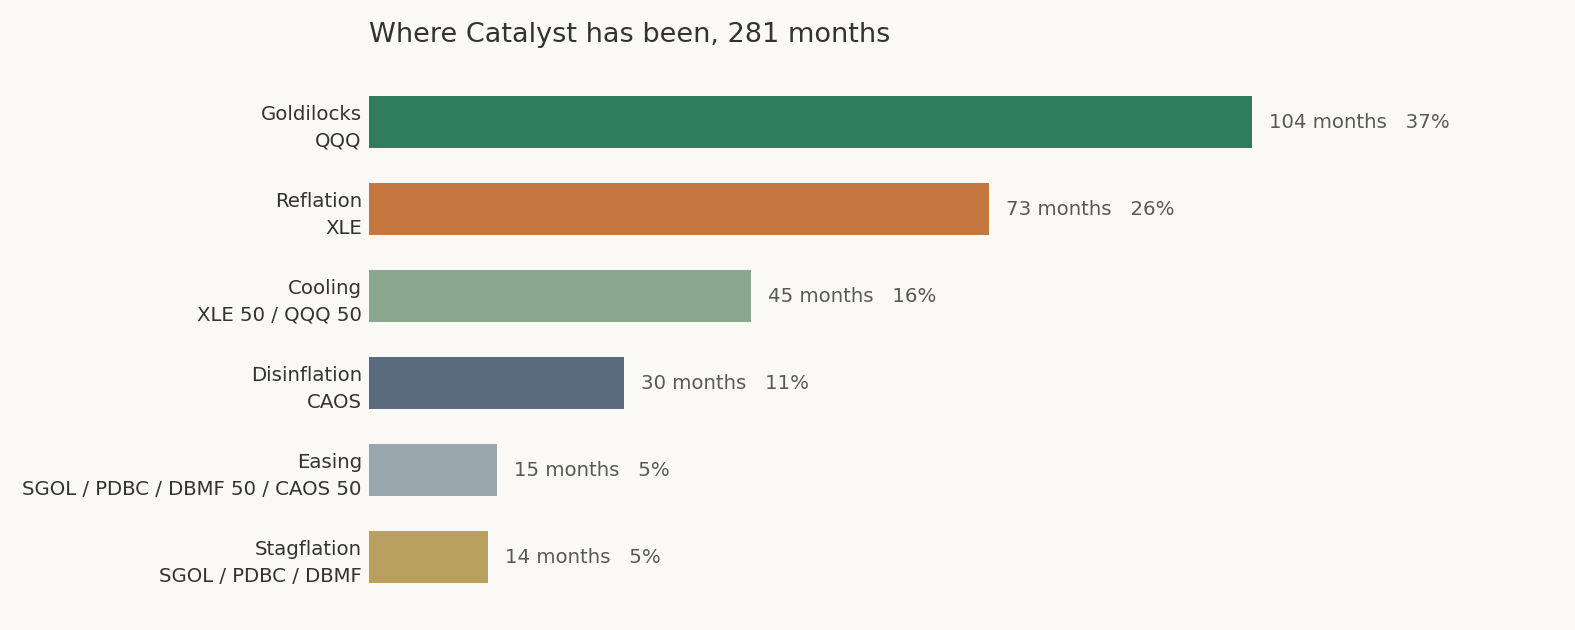
Technology and energy between them account for about two thirds of all months, and the two split states another fifth. The defensive quadrants are rare by design, which is worth understanding before you allocate: this is a strategy that spends most of its life in a risk asset.
Things worth knowing before you allocate
Risk-adjusted return peaks at the 200, not the 300. The 300 buys about eight more points of CAGR and pays for all of it in drawdown and tail. It exists for people who want maximum notional leverage and understand what that means, not because it is the best member of the family.
This is concentrated. One position, or two. There is no cash sleeve and no diversification within a quadrant. That concentration is where the returns come from, and it is also why I think of Catalyst as a satellite allocation rather than a core holding. Size it accordingly.
The record starts in 2003. The breakeven rate Catalyst depends on did not exist before then. I spent a long time trying to extend it honestly, with realized CPI, with survey expectations, with producer prices, with oil, with a dozen market-priced substitutes, and none of them worked well enough to publish. Twenty-three years is shorter than the rest of the site and I would rather say so than dress it up.
Best in a tax-deferred account. Regime changes produce short-term gains.
Attribution
The idea of using the breakeven inflation rate to decide where to sit in a Permanent Portfolio style quadrant is fully credited to David Varadi and his Inflation Compass. I had never managed to get the Q's into a strategy to my own satisfaction, and David seems to have cracked it by using the breakeven rate.
Catalyst is not a copy. It splits the level from the direction to create a third inflation state with blended allocations where Inflation Compass is binary, it uses a different lookback and a different index for growth, and while we both use energy and technology as the growth drivers, Catalyst uses a three-asset sleeve for stagflation instead of utilities, and tail-risk convexity instead of consumer staples and Treasuries. It adds an energy circuit breaker, drift bands, and in true DMS fashion, two Smart Leverage versions.
David is not the first to use the breakeven rate in a strategy, though as far as I know he is the first to build a quadrant strategy around it, and kudos for that. Composer has been using it since 2013, Macrosynergy since 2022, and AQR as far back as 2010.
Catalyst Cover Art
Full strategy details, current allocations and the complete methodology are on the Catalyst strategy page.
This is a Premium strategy. Allocations and returns are obscured for non-Premium members for the first 10 days of the month.
Past performance, including backtested results, is not indicative of future results. Backtested performance is hypothetical, does not reflect actual trading, and benefits from hindsight in the selection of strategy rules. Portions of the history rely on reconstructed proxy data for funds that did not exist for the full period. Investors should carefully consider their risk tolerance and consult with a financial advisor.