Strategy performance enhancements
My focus recently was directed at getting the new DMS site launched, and also creating the engine behind it all - but I also had some time to improve two of the main strategies at DMS, Triad and Global Navigator (and their leveraged versions.)
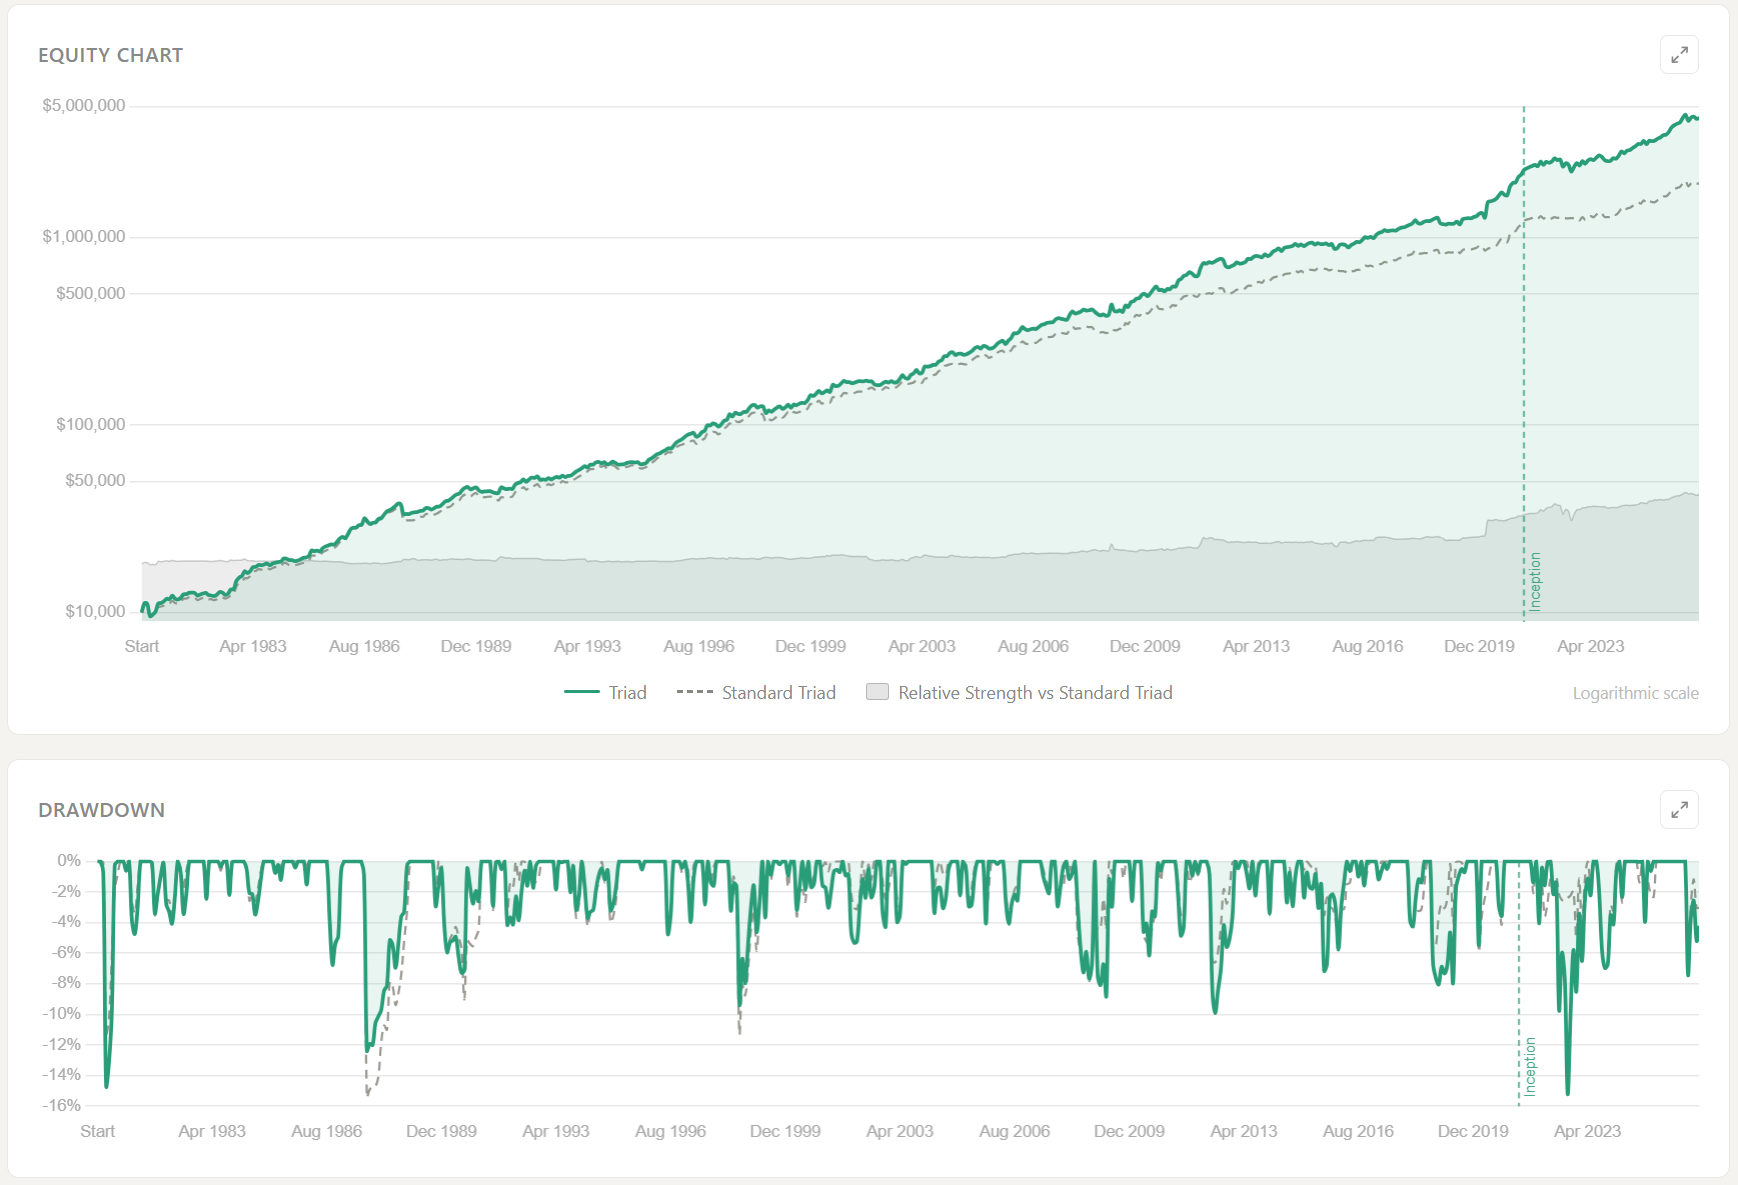
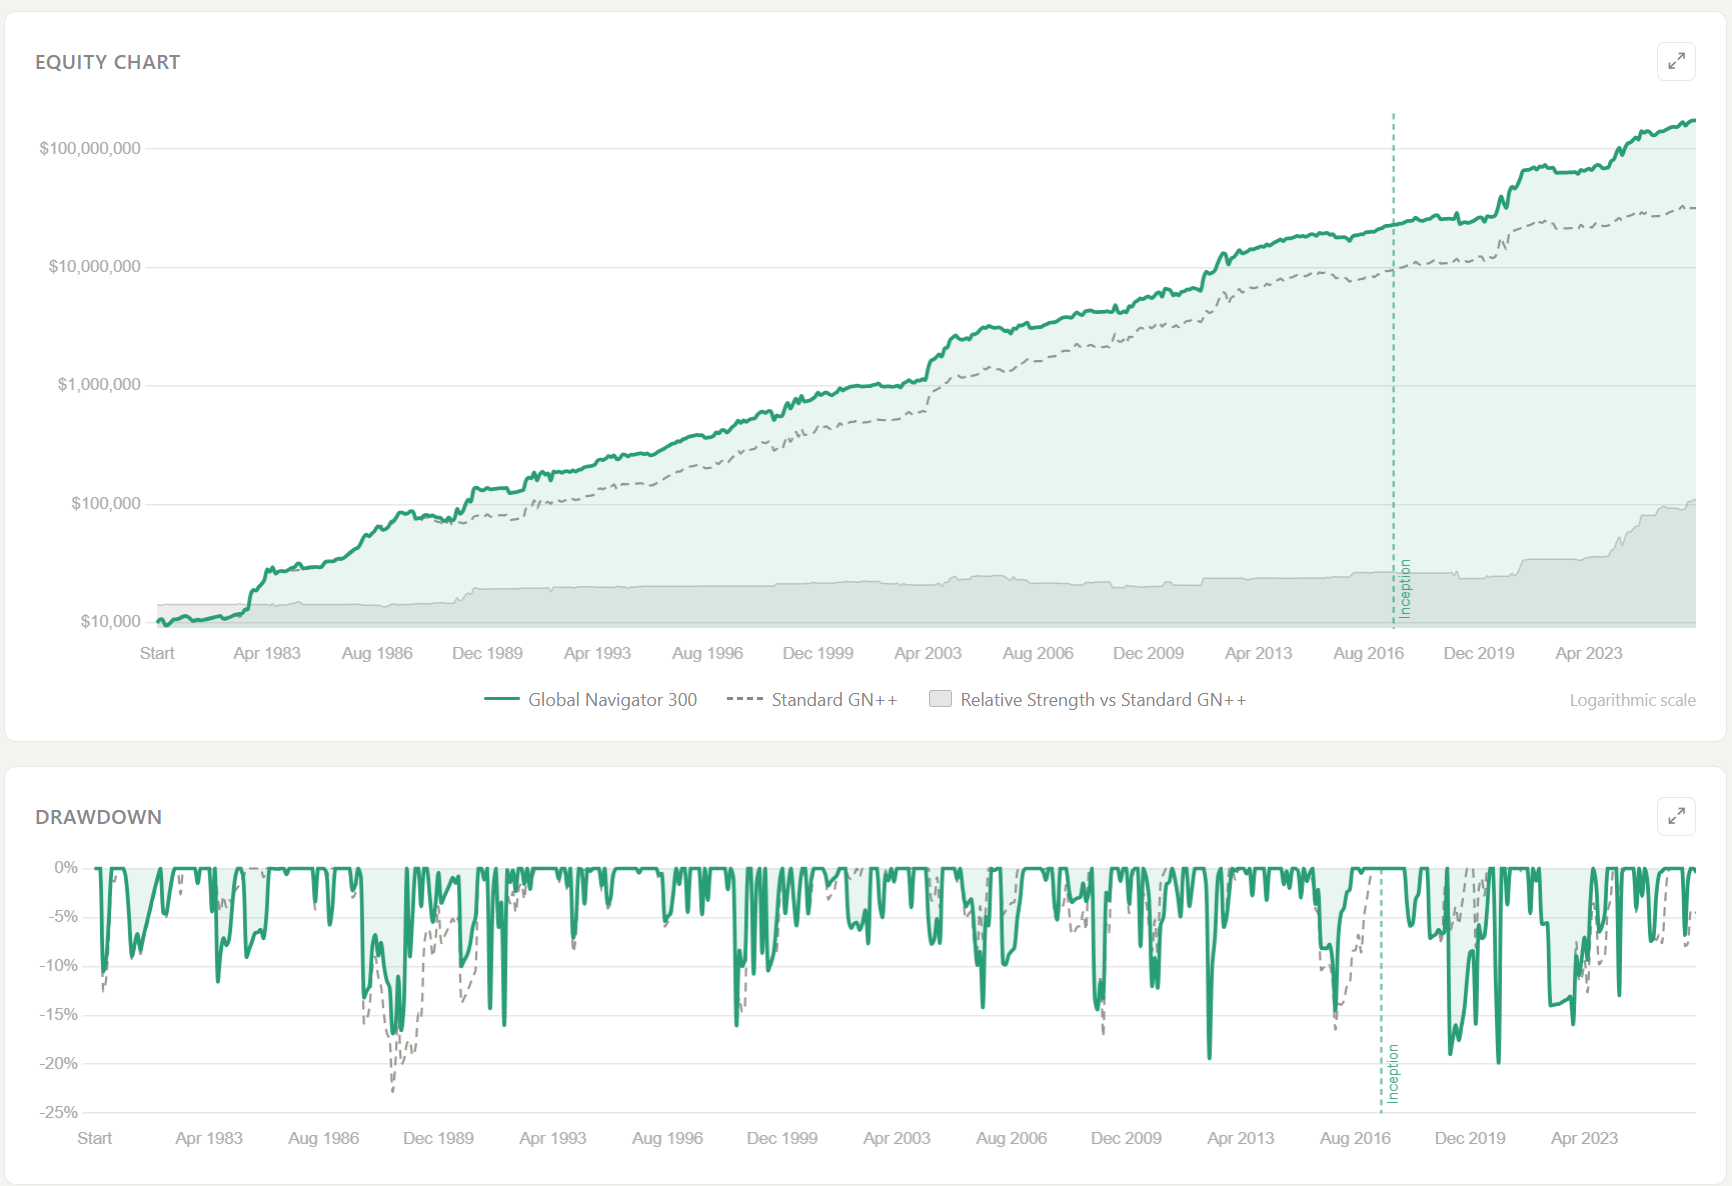
Take a look at the performance below for the base Triad strategy, and the 3X Smart Leverage Global Navigator 300. These results are with Trade Friction turned off, easier for me to compare this way. Solid CAGR gains WITH lower Max Drawdowns, I call that a win-win.
Global Navigator I updated to split the international allocation to a split of VXUS and DBEF instead of just VXUS, this did add gains over the life of the strategy - honestly that wasn't why I made the change though, the US currency hedged DBEF sometimes outperforms, and VXUS sometimes outperforms - I figured why not split it down the middle instead of trying to go with the one which will do better. BOXX and CAOS were slotted in as the primary the Risk Off assets. Another change I am going to keep to myself for now, but I'll give a clue, as a CAKE (band) fan, I called this change Prolonging the Magic. Prolonging the Magic accounts for the bulk of the performance increases. Averge months between trades increased as a result of these changes from ~ 3.5 to 4.0.
Triad now also splits the International allocation between both VXUS and DBEF - hard to argue when it better covers that allocation. The weighted lookback for Triad is different than Global Navigator, this is on purpose so they work differently from each other - gains were made by adjusting this lookback. Allocation weights are different in the new version of Traid: 30% Gold/Commodities, 35% US Large Cap, 35% Mid-Cap Value/International. The old Triad used BIL, VGSH, VCSH, and VGIT. Averge months between trades increased as a result of these changes from ~ 1.65 to 2.15.
TRIAD
| Variant | CAGR | Max DD | UPI |
|---|---|---|---|
| Standard | 12.00% | -15.41% | 2.71 |
| RIA | 13.66% | -16.13% | 2.65 |
| New | 13.92% | -15.20% | 3.09 |
G-Nav 300
| Variant | CAGR | Max DD | UPI |
|---|---|---|---|
| Standard | 18.93% | -23.47% | 2.54 |
| RIA | 21.85% | -22.80% | 2.95 |
| New | 23.32% | -19.70% | 3.55 |
Here are two charts showing the standard Triad vs the new Triad on the site, and the same for Global Navigator 300.