Trading Friction, Rebuilt: What It Really Cost to Trade, Era by Era
Every backtest on this site is shown net of trading friction by default, because we all want to see what would really have happened, both in a backtest and in live results as they come in month to month, rather than results without trading friction. A strategy that trades has to pay something every time it buys or sells, and a backtest or live record that ignores that cost overstates what anyone would actually have earned.
What changed is how the cost is estimated. This post covers how it used to be done, what was wrong with it, how it works now, and what it did to the results.
How it used to work
The old model was simple. Every trade was charged a flat one-way cost, set by how leveraged the fund was:
| Fund | One-way cost, old model |
|---|---|
| Unleveraged ETFs (VOO, IEF, GLD, BIL...) | 10 bps (0.10%) |
| 2x leveraged ETFs (SSO, QLD) | 15 bps |
| 3x leveraged ETFs (UPRO, TQQQ) | 20 bps |
The same rates applied to every month from 1980 to today. The thinking was that leveraged funds are riskier and more expensive to trade, so they should pay more, and that a flat 10 bps was a reasonably conservative figure for everything else.
The turnover side of the model was already sound and has not changed. Each month, the strategy's new target weights are compared against what it was actually holding as the month opened, after the prior month's returns moved the weights around. Only the slices that really have to be bought or sold are charged. A month spent holding costs nothing.
What was wrong with it
A conversation made me take a harder look at the rate itself. The person I was talking with pointed out that leverage is not what drives trading cost. Liquidity is. They were right.
TQQQ is a 3x fund, and it trades on a one-cent spread most days, a cost of about a basis point. A small, thinly traded unleveraged fund can cost twenty times that. Charging TQQQ double what a thin fund pays had it exactly backwards.
Once I started pulling the actual figures, two more problems showed up.
Today's costs were overstated. Almost every US ETF publishes its 30-day median bid/ask spread. For the big, liquid funds the strategies hold most of the time, VOO, QQQ, IEF, TLT and BIL, the spread is about 1 bp. The old model was charging 10.
The past was understated, badly. The backtests start in 1980. There were no ETFs then. Until May 1975 brokerage commissions were fixed by the exchanges, and through the 1980s a round trip in an index fund or a basket of stocks cost far more than it does now. Prices were quoted in eighths of a dollar until 1997 and in sixteenths until 2001. Charging 10 bps for a trade in 1985 was far too generous.
So the old flat rate was too high for recent years and too low for the early years. Those errors do not cancel out, because strategies do not trade the same amount in every era, and some strategies only have history in the recent era.
How it works now
Each traded slice is now charged:
cost = the higher of (the fund's own cost, the era minimum) x a market-stress multiplier
The fund's own cost. Each fund's published 30-day median bid/ask spread, charged in full on every buy and every sell. A patient limit order at the midpoint would pay only half the spread, but trades placed at the open or close, or as market orders, often pay more, and the median sits below the average because bad days skew it. Charging the full spread covers that, with commissions included. A fund with no published figure is charged 10 bps.
The era minimum. No trade pays less than what was realistic for its time:
| Period | Minimum, one way | Why |
|---|---|---|
| Before May 1975 | 50 bps | Fixed brokerage commissions |
| May 1975 to 1992 | 25 bps | No ETFs yet; these years use index data |
| 1993 to mid-1997 | 15 bps | First ETFs, prices quoted in eighths |
| Mid-1997 to 2000 | 8 bps | Sixteenths, early online brokers |
| 2001 to 2007 | 3 bps | Decimal pricing, $8 to $10 commissions |
| 2008 onward | 2 bps | Modern spreads |
These are estimates built from those market milestones and the published research on historical trading costs, not measured figures. I chose them to sit on the conservative side.
The market-stress multiplier. Spreads widen when the whole market panics, and tactical strategies tend to trade most at exactly those moments. Each month's cost is multiplied by the prior month-end VIX divided by 20, never less than 1x and capped at 4x. A calm market pays 1x. Late 2008 and April 2020 paid close to 3x. Before 1990 there is no VIX, so a stand-in built from the stock market's own recent volatility is used, which means the 1987 crash is charged for too.
Here is what that does to the cost of a single trade in an S&P 500 fund across the whole record:
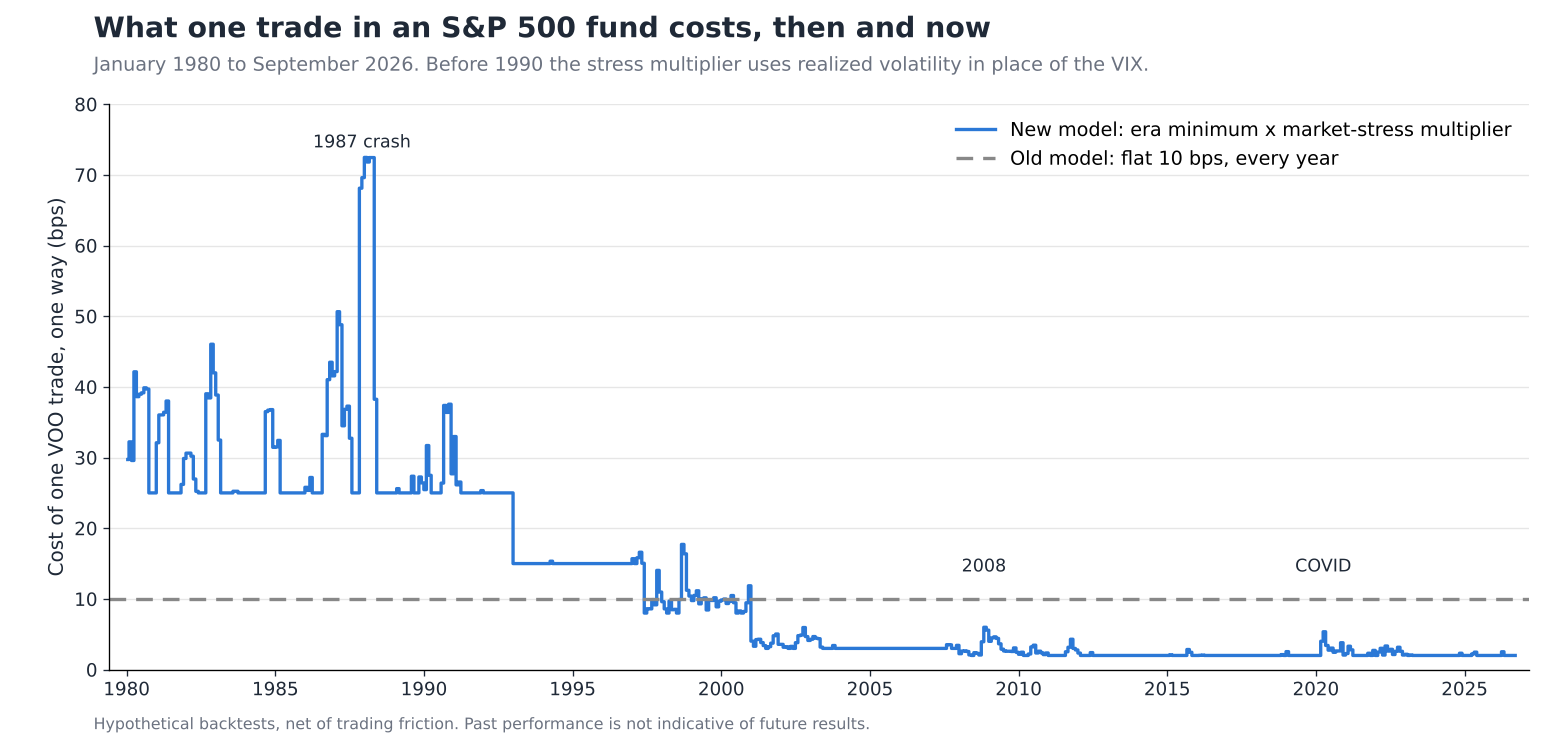
In the 1980s a trade cost 25 to 70 bps depending on how rattled the market was. Through the mid-1990s it was 15 bps. From 2001 on it settles to 2 to 3 bps in calm markets, with short spikes in 2008, 2011, 2020 and 2022. The old flat 10 bps was wrong in almost every month, just in different directions.
The full details are in the FAQ: How does the Trading Friction toggle work?
The effect by era
The clearest way to see what changed is to look at how much return each strategy gave up to trading, era by era, under each model.
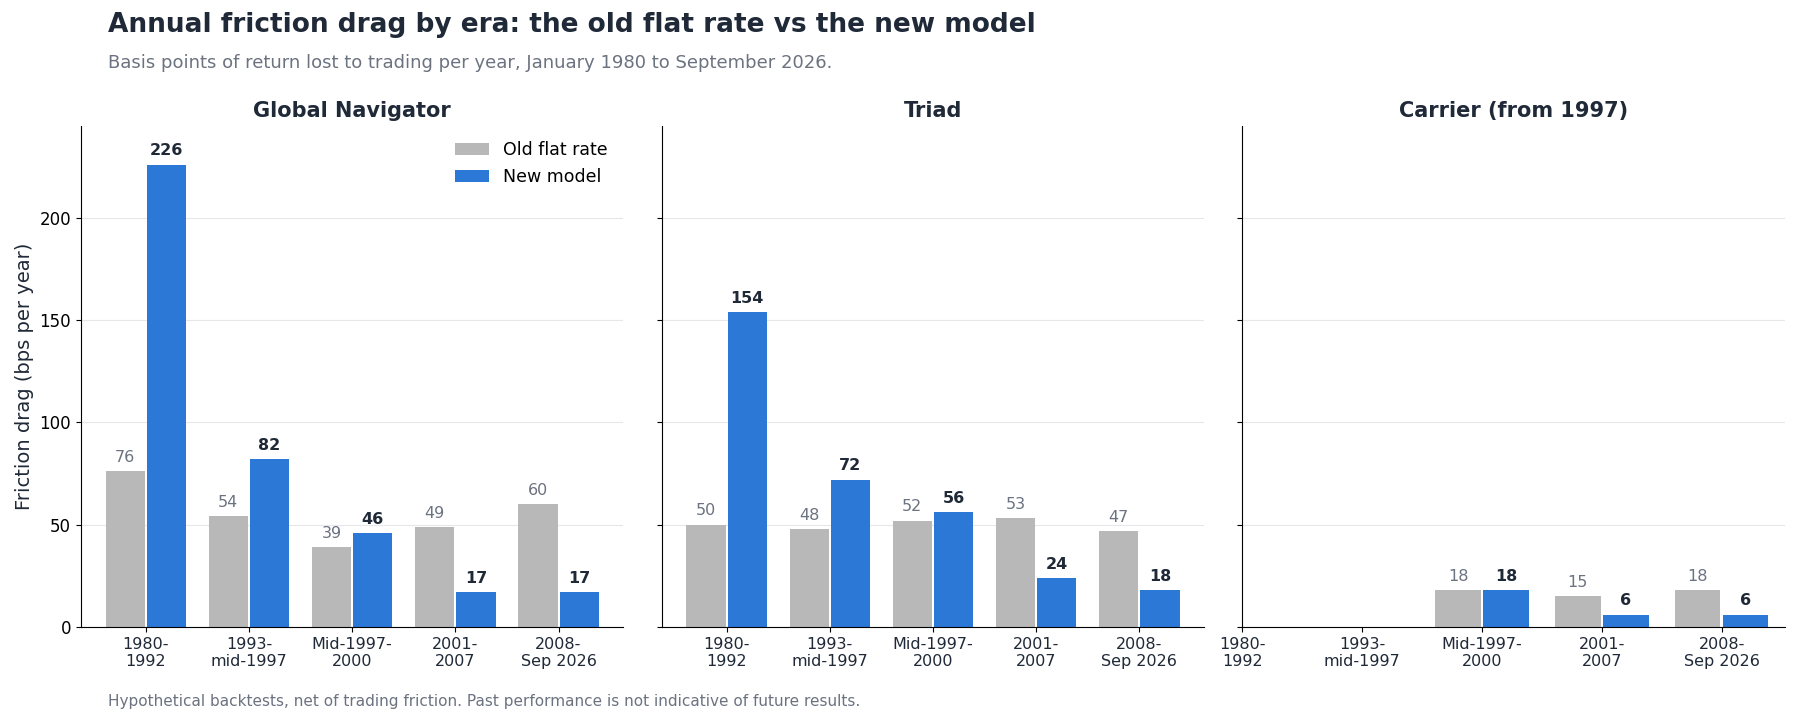
| Era | Era minimum | Average stress multiplier | Global Navigator, old → new | Triad, old → new | Carrier, old → new |
|---|---|---|---|---|---|
| 1980 to 1992 | 25 bps | 1.22x | 76 → 226 | 50 → 154 | - |
| 1993 to mid-1997 | 15 bps | 1.00x | 54 → 82 | 48 → 72 | - |
| Mid-1997 to 2000 | 8 bps | 1.24x | 39 → 46 | 52 → 56 | 18 → 18 |
| 2001 to 2007 | 3 bps | 1.12x | 49 → 17 | 53 → 24 | 15 → 6 |
| 2008 to Sep 2026 | 2 bps | 1.15x | 60 → 17 | 47 → 18 | 18 → 6 |
Friction drag in basis points of return per year. Carrier's history begins in January 1997.
The pattern is the same for every strategy that trades regularly. In the 1980s the new model charges about three times what the old one did. In the mid-1990s it charges about half again as much. From 2001 on it charges well under half, often about a third. In the modern era, a strategy that rotates most months is giving up something under 20 bps a year, not 50 or 60.
What it did to the headline numbers
Whether a strategy's full-history return went up or down depends almost entirely on when its history starts.
| Strategy | History from | Friction cost per year, old → new | Net CAGR, old → new |
|---|---|---|---|
| Global Navigator | 1980 | 0.69% → 0.95% | 14.48% → 14.21% |
| Global Navigator 300 | 1980 | 0.80% → 0.89% | 22.25% → 22.16% |
| Triad | 1980 | 0.56% → 0.74% | 14.62% → 14.43% |
| Triad 170 | 1980 | 0.64% → 0.79% | 17.13% → 16.96% |
| HAA | 1980 | 0.66% → 0.79% | 14.37% → 14.24% |
| Permanent Portfolio DMS | 1980 | 0.01% → 0.02% | 8.97% → 8.96% |
| Carrier | 1997 | 0.19% → 0.08% | 12.86% → 12.96% |
| Carrier 240 | 1997 | 0.40% → 0.12% | 17.91% → 18.19% |
| Catalyst | 2003 | 0.71% → 0.23% | 23.43% → 23.91% |
| Catalyst 300 | 2003 | 1.05% → 0.28% | 39.52% → 40.28% |
| Quiet Compounding | 2003 | 0.57% → 0.19% | 15.73% → 16.10% |
January of the start year (May 2003 for Catalyst and Quiet Compounding) through September 2026.
Strategies with history back to 1980 now carry the expensive 1980s in full, so their long-run returns came down by roughly a tenth to a quarter of a point. Strategies that start in 1997 or 2003 never saw that era and now benefit from modern spreads, so their returns went up. Catalyst 300 gained more than three-quarters of a point a year. The leveraged versions gained the most, because the old model's 15 and 20 bps leverage surcharge is gone.
I'll admit Triad surprised me. I expected a strategy that trades often to come out ahead under a model that charges a lot less today. It did come out ahead for every year since 2001, but the 1980s more than took it back. That is the right answer. The point of this work was to make the numbers more accurate, not more flattering.
Buy-and-hold style allocations, like Permanent Portfolio DMS, barely moved. They trade once a year, so the rate charged hardly matters.
What it means for comparing strategies
Two things are worth keeping in mind.
A long backtest now carries a real handicap for its early years. When you compare a 1980-start strategy against a 2003-start strategy over their own full histories, the older one is paying for an era the newer one never traded in. That was always true of market conditions; now it is true of trading costs as well. If you are comparing strategies on Dual Momentum Systems, view them together: the date range will be in sync, and so will the trading friction costs.
The modern-era numbers are closer to what you will actually pay. If you trade the strategies today in liquid ETFs, the friction you should expect is the 2008-onward column, not the full-history average.
Where the estimate is still approximate
- Spreads are a recent snapshot applied to each fund's whole history, subject to the era minimum. A fund that was thin when it launched and is liquid today is charged today's cost.
- Some funds do not publish their spread. For those the cost is estimated from the share price and trading volume.
- Order size is not modeled. The figures suit an individual account. A large order in a thin fund would cost more.
- The era minimums are estimates. They are grounded in the market milestones above and the research on historical trading costs, but nobody published a bid/ask spread for an index fund that did not exist in 1985.
You can always turn off trading friction and see unadjusted returns and metrics on the site too. Just remember that nobody earns those in a real account.
Past performance, including backtested results, is not indicative of future results. Backtested performance is hypothetical and does not reflect actual trading. Trading costs before each fund's launch, and before ETFs existed, are estimates.