Strengthening the Backtest: Honest Stand-Ins for Funds That Did Not Exist Yet
Some of the best ETFs available today did not exist 20, 30, or 50 years ago (even in mutual fund form). A long/short equity fund, a tail-risk fund and a global macro fund have all been held by DMS strategies, and none of them has a real record going back to 1980. So the years before each fund existed have to be filled in with something.
That something matters. A stand-in that is too generous makes a strategy look better than it could ever have been, and one that doesn't mimic how the ETF would have behaved can produce signals that would never actually have happened. I recently went back over the stand-ins for three of these funds, CLSE, CAOS and HFGM, and came to a conclusion: even though the CLSE and HFGM stand-ins were built on indexes that are highly correlated with those funds, and a lot of care had gone into building them, they still were not as defensible as they need to be. So I changed them. This post covers what changed, why, and what it did to the numbers.
Why this matters to me
I invest in these strategies myself. My goal has always been to be honest and conservative with the results, and that means the backtest has to hold up when someone pokes at it. If a number on this site depends on a reconstruction I cannot explain and defend, it does not belong there.
CLSE: the change that matters most
CLSE is the Convergence Long/Short Equity ETF. It holds stocks it likes and shorts stocks it does not, and typically runs at roughly 65% to 70% net long. It became an ETF in February 2022, and before that the same manager ran the same process as a mutual fund, MARNX, back to January 2010. From 2010 on, every DMS strategy that holds CLSE uses real fund returns.
Before 2010 there is no fund at all. The previous stand-in was a regression on a BarclayHedge long/short equity index, with a factor model filling the earlier years. Here is what it produced over the years just before the real history begins.
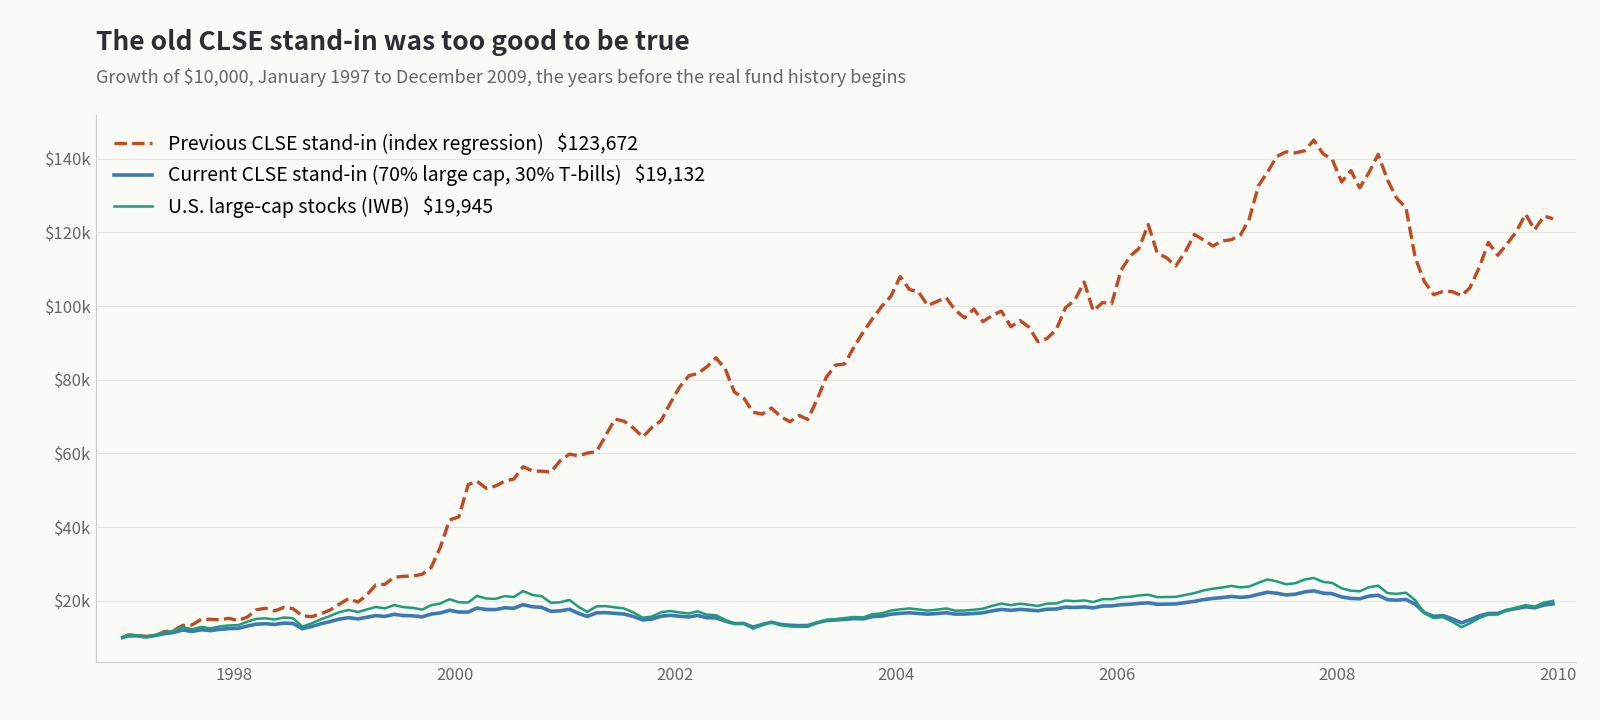
This stretch included two bear markets of around 50%, a great environment for a long/short fund, but these results are highly optimistic and paint too pretty a picture. Once I saw it laid out like that, it was impossible to defend.
The replacement is deliberately plain: 70% U.S. large-cap stocks and 30% Treasury bills, rebalanced monthly. The 70% is at the top of CLSE's typical net long range. It gives the fund its market exposure and nothing more.
Intellectually, I know the real fund would very likely have done better than this blend. Since 2010 CLSE has shown genuine stock-picking skill. But I cannot prove what that skill would have been worth in 1987 or 2002, before the fund existed, and there simply was not a good substitute before the Convergence fund came along. So the pre-2010 stand-in now credits it with no skill at all. If that errs, it errs on the conservative side, which is the side I want it to err on.
Triad by no means falls apart when all of the non-actual CLSE returns are removed, but the result is a more truthful representation of how it would have performed during that era.
CAOS: a small change, and a cleaner one
CAOS is a tail-risk fund. It holds options designed to pay off when stocks fall hard. It has its own ticker from April 2023, and before that it ran as the AVOLX mutual fund back to September 2013. Those are real returns.
Before September 2013, the old stand-in was a momentum rotation across short-term corporate bonds, short-term Treasuries, T-bills and long Treasuries. It was a manufactured series, a strategy standing in for a fund, and it did not behave like a tail-risk hedge at all: it earned more than real CAOS has, and it tended to rise with stocks rather than against them.
There is no honest way to reconstruct a tail-risk fund's early history, because its results depend on option pricing and hedge design that no index captures. So rather than manufacture one, the years before September 2013 now use intermediate-term Treasuries (IEF). IEF is not a tail-risk hedge either, and it will not show the crash payoffs CAOS is built for. But it is a plain holding, a real fund from 2002 and Treasury market data before that, rather than a strategy dressed up as a fund.
The effect was mixed, and small. Catalyst, which holds CAOS in some of its regimes, gave up about half a point of annual return from its May 2003 start, 24.5% to 23.9%. In exchange, its worst drawdown improved from -14.4% to -12.2% and its Ulcer Performance Index rose from 5.10 to 5.43. A little less return, a smoother ride, and a history that no longer depends on a manufactured series.
HFGM: retired from the lineup
HFGM is a global macro fund that launched in 2025. Its earlier history was built from the Barclay Global Macro Index and similar indexes, and before 1997 from a model fitted to reproduce that index. That is a model built on a model, and at the end of the day it just felt like a poor proxy.
Only one strategy relied on HFGM's reconstructed history: Permanent Portfolio DMS, where it shared the prosperity quadrant with CLSE. (Family Office Blueprint also holds HFGM, but only since mid-2025, so it has only ever used the real fund.) Rather than keep a holding I could not back up, I removed it, and that quadrant is now CLSE alone.
That raised a second question. Because CLSE runs only about 70% net long, a straight 25% in it carries only around 17% in net stock exposure, well short of the quarter Harry Browne intended for prosperity. So the prosperity quadrant now holds 32.5%, and the other three quadrants, gold, managed futures and tail risk, hold 22.5% each. In net exposure terms that keeps the four quadrants roughly equal, which is the whole idea of the Permanent Portfolio. I tested the weights from 25% up to 40% in CLSE, and the results moved smoothly with no peak to chase. 32.5% sits in the middle.
The Permanent Portfolio DMS page has the details, and Lowkey, which holds it, is now split 50/50 with Carrier.
What it did to Triad
Triad can hold CLSE in its third sleeve, so it felt the CLSE change most.
| Triad | Before | After |
|---|---|---|
| Full history, Jan 1980 to Sep 2026 | +15.5% a year | +14.4% a year |
| 1980s | +17.9% | +18.3% |
| 1990s | +14.5% | +11.1% |
| 2000s | +14.9% | +12.8% |
| Jan 2010 to Sep 2026 | +15.2% | +15.2% |
| Worst drawdown, full history | -13.9% | -13.3% |
Net of trading friction. Before and after differ only in the CLSE stand-in used before 2010.
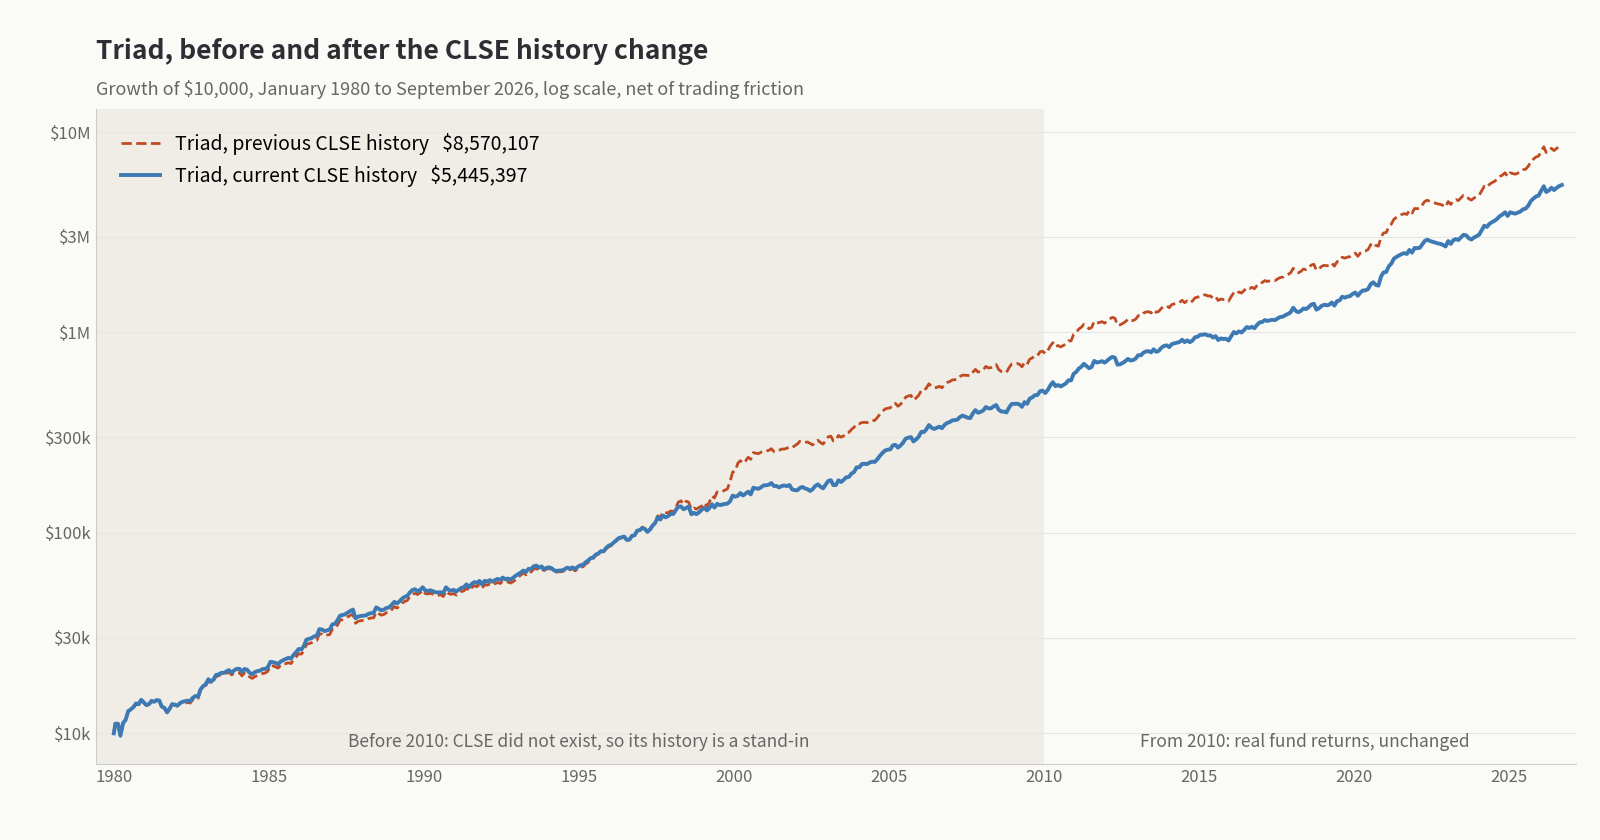
The record from 2010 forward is unchanged, because from 2010 on Triad uses the real fund's returns either way. The only exception is a few months in early 2010, when Triad's lookback still reached into the old pre-2010 numbers. All of the difference sits in the 1990s and 2000s, which is exactly where the old stand-in was running at four times the market's return.
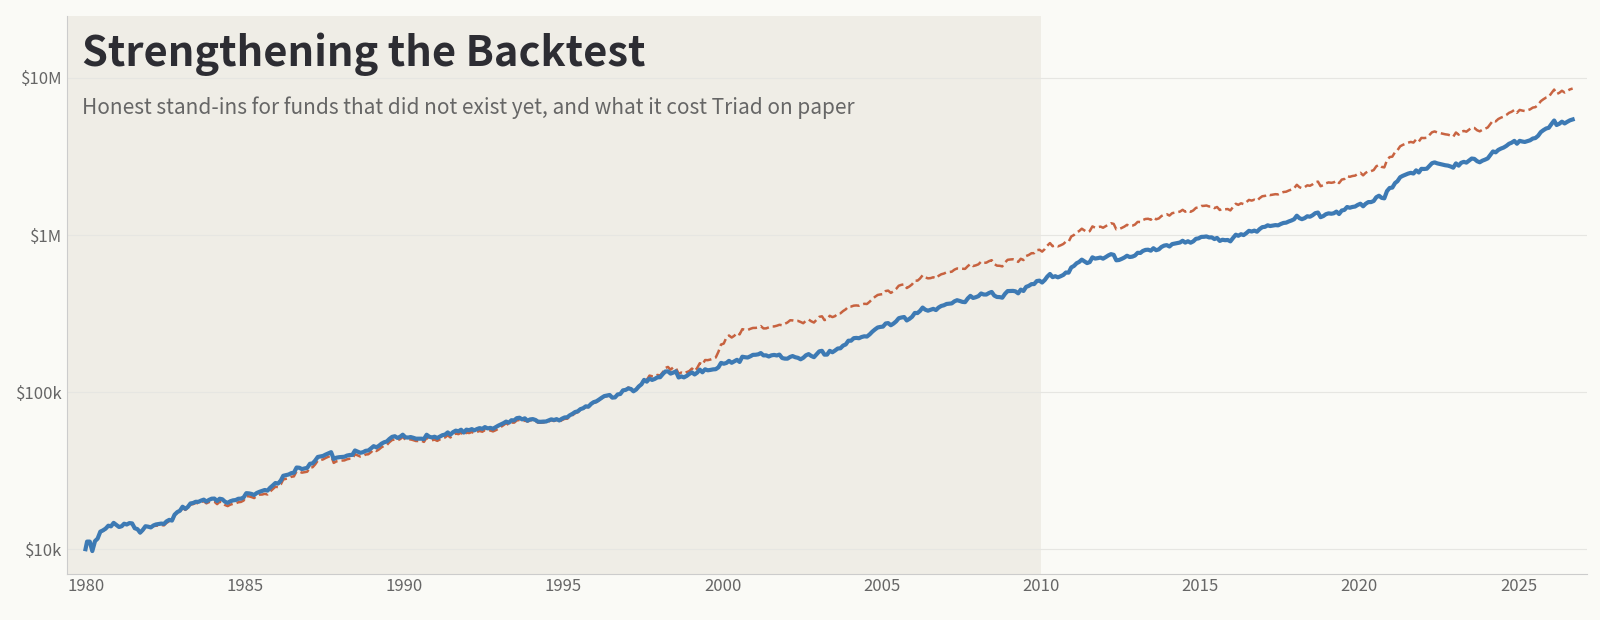
Over the full history, that takes Triad from about 15.5% a year to about 14.4%. Compounded over almost 47 years it is a big difference on paper: $10,000 grows to about $5.4 million instead of $8.6 million. Its worst drawdown actually got slightly shallower, and that is still against 12.0% a year for the S&P 500 over the same period, with a worst decline of 51%.
Triad is still a fantastic strategy. The live-fund era is unchanged, and the long history now rests on a stand-in I can defend line by line.
The rest of the lineup
The same changes ripple through every strategy that holds these funds, or holds a strategy that does. Here are the main ones.
| Strategy | History from | Before | After |
|---|---|---|---|
| Triad | 1980 | +15.5% | +14.4% |
| Triad 170 | 1980 | +18.0% | +17.0% |
| Carrier | 1997 | +13.8% | +13.0% |
| Catalyst | 2003 | +24.5% | +23.9% |
| Quiet Compounding | 2003 | +16.2% | +16.1% |
| Permanent Portfolio DMS | 1980 | +10.0% | +9.0% |
| Lowkey | 1997 | +12.1% | +10.6% |
Full-history CAGR, net of trading friction, through September 2026. Catalyst and Quiet Compounding start in May 2003. The Permanent Portfolio DMS and Lowkey figures also include their new allocations, not just the new data.
For Triad and Carrier, and their leveraged versions, the record from 2010 on is the same as before, to within a tenth of a point a year. Catalyst and the portfolios built on it also change from 2010 to 2013, because CAOS's real history only begins in September 2013. Permanent Portfolio DMS and Lowkey change throughout, because their allocations changed too.
What I take from it
A backtest is only as good as the weakest series in it, and a series that flatters a strategy is the worst kind of weakness, because it is the one nobody is motivated to question. I would rather publish a lower number I can stand behind than a higher one that falls apart the first time someone asks where it came from.
How DMS builds history for funds that did not exist yet is explained in this FAQ. If you find a stand-in you think is too generous, tell me.
Past performance, including backtested results, is not indicative of future results. Backtested performance is hypothetical, does not reflect actual trading, and benefits from hindsight in the selection of strategy rules. Portions of the history rely on reconstructed proxy data for funds that did not exist for the full period. Investors should carefully consider their risk tolerance and consult with a financial advisor.