Quiet Compounding: Four Engines, One Smoother Ride
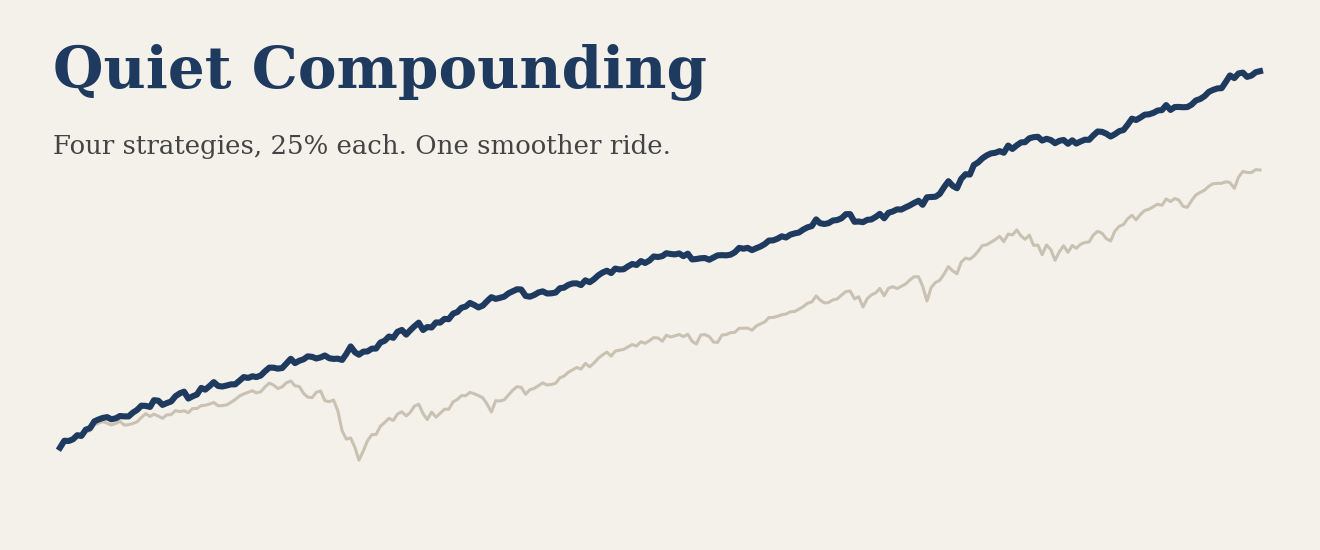
Quiet Compounding is not a strategy in its own right. It is a portfolio of strategies, and the whole idea fits in one sentence: Combine several strategies which are really good on their own, and combine them for even better overall risk adjusted performance. They each have different holdings, and factors that make them change allocation, so they react to market conditions differently - but complementary when combined.
With the recent introduction of Catalyst and Carrier, Quiet Compounding has been adjusted to include them. It now holds four strategies at 25% each, every one in its base, unleveraged form:
| Component | What drives it |
|---|---|
| Carrier | Credit regime. Stays in a diversified growth portfolio (IWB, QQQ, DBMF, CLSE) and moves to Treasuries only when the high yield credit spread signals real stress. |
| Catalyst | Macro regime. Reads growth from large-cap trend and inflation from the five-year breakeven rate, and owns what each regime has historically rewarded. |
| GPMv | Protective momentum. My variant of Keller and Keuning's GPM, scaling between risk assets and Treasuries on momentum and correlation. |
| Triad | Three independent momentum sleeves: real assets, U.S. large cap, and a relative strength sleeve, each with its own Treasury fallback. |
The four are rebalanced to 25% each January and only in January. In between, the weights drift with each component's returns, while each component manages its own holdings monthly.
Ground rules
Everything below runs from May 2003 through September 2026, 281 months. The start date is set by Catalyst, whose inflation signal depends on the five-year breakeven series. All returns are monthly and net of the same trading friction applied everywhere on the site. Sharpe uses the actual return on cash over the window as its risk-free rate, and so does UPI.
Against the benchmarks
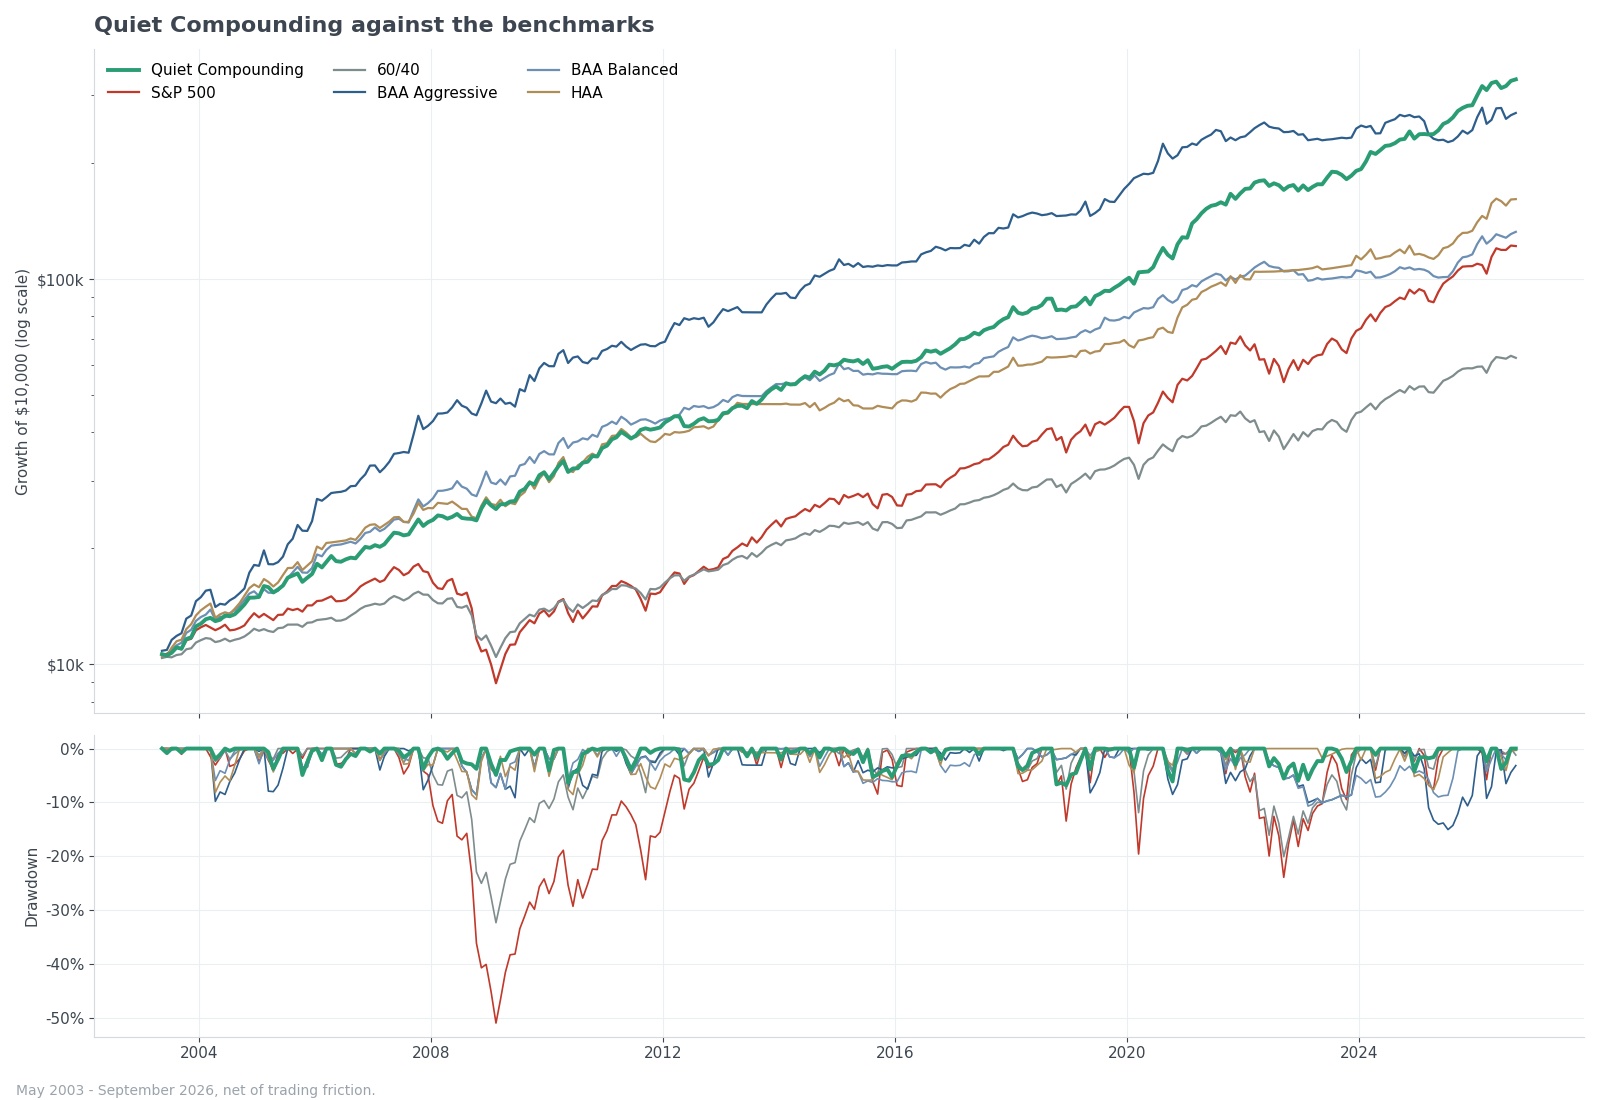
Ten thousand dollars in Quiet Compounding in May 2003 grew to about $330,000 through September 2026. The same money in the S&P 500 grew to $122,000, and in a 60/40 portfolio to $62,000.
The return is the smaller part of the story. Look at the drawdown panel. The S&P 500 fell 51% in the financial crisis and 60/40 fell 32%. Quiet Compounding's worst decline in 23 years was 6.8%. It actually made money in 2008, finishing the year up 13.7% while the S&P 500 lost 37%.
I included three of Keller and Keuning's tactical strategies because they are both well known and well constructed strategies [for tax deferred accounts]. BAA Aggressive is the interesting one: it led Quiet Compounding in growth for most of the record and was only passed for good in early 2025. It got there with more than twice the drawdown, though, and it has spent most of the last two years below its prior high. HAA comes closest on drawdown at -9.4%, but at about 3.5 points a year less return.
| CAGR | Max DD | Ulcer Index | UPI | Sharpe | Sortino | |
|---|---|---|---|---|---|---|
| Quiet Compounding | 16.1% | -6.8% | 2.03 | 7.13 | 1.53 | 3.52 |
| S&P 500 (VOO) | 11.3% | -51.0% | 11.72 | 0.82 | 0.71 | 1.26 |
| 60/40 | 8.1% | -32.3% | 6.48 | 1.00 | 0.72 | 1.39 |
| BAA Aggressive | 15.1% | -15.0% | 4.27 | 3.16 | 1.08 | 2.39 |
| BAA Balanced | 11.7% | -10.7% | 3.44 | 2.92 | 1.15 | 2.79 |
| HAA | 12.6% | -9.4% | 2.60 | 4.22 | 1.14 | 2.60 |
The longest time to recover a drawdown in Quiet Compounding is 15 months. Over the same window the S&P 500's was 62 months and 60/40's was 39. Its worst rolling twelve months was -2.6%, and over every three-year window in the record it compounded at no less than 7.9% a year.
Against its own parts
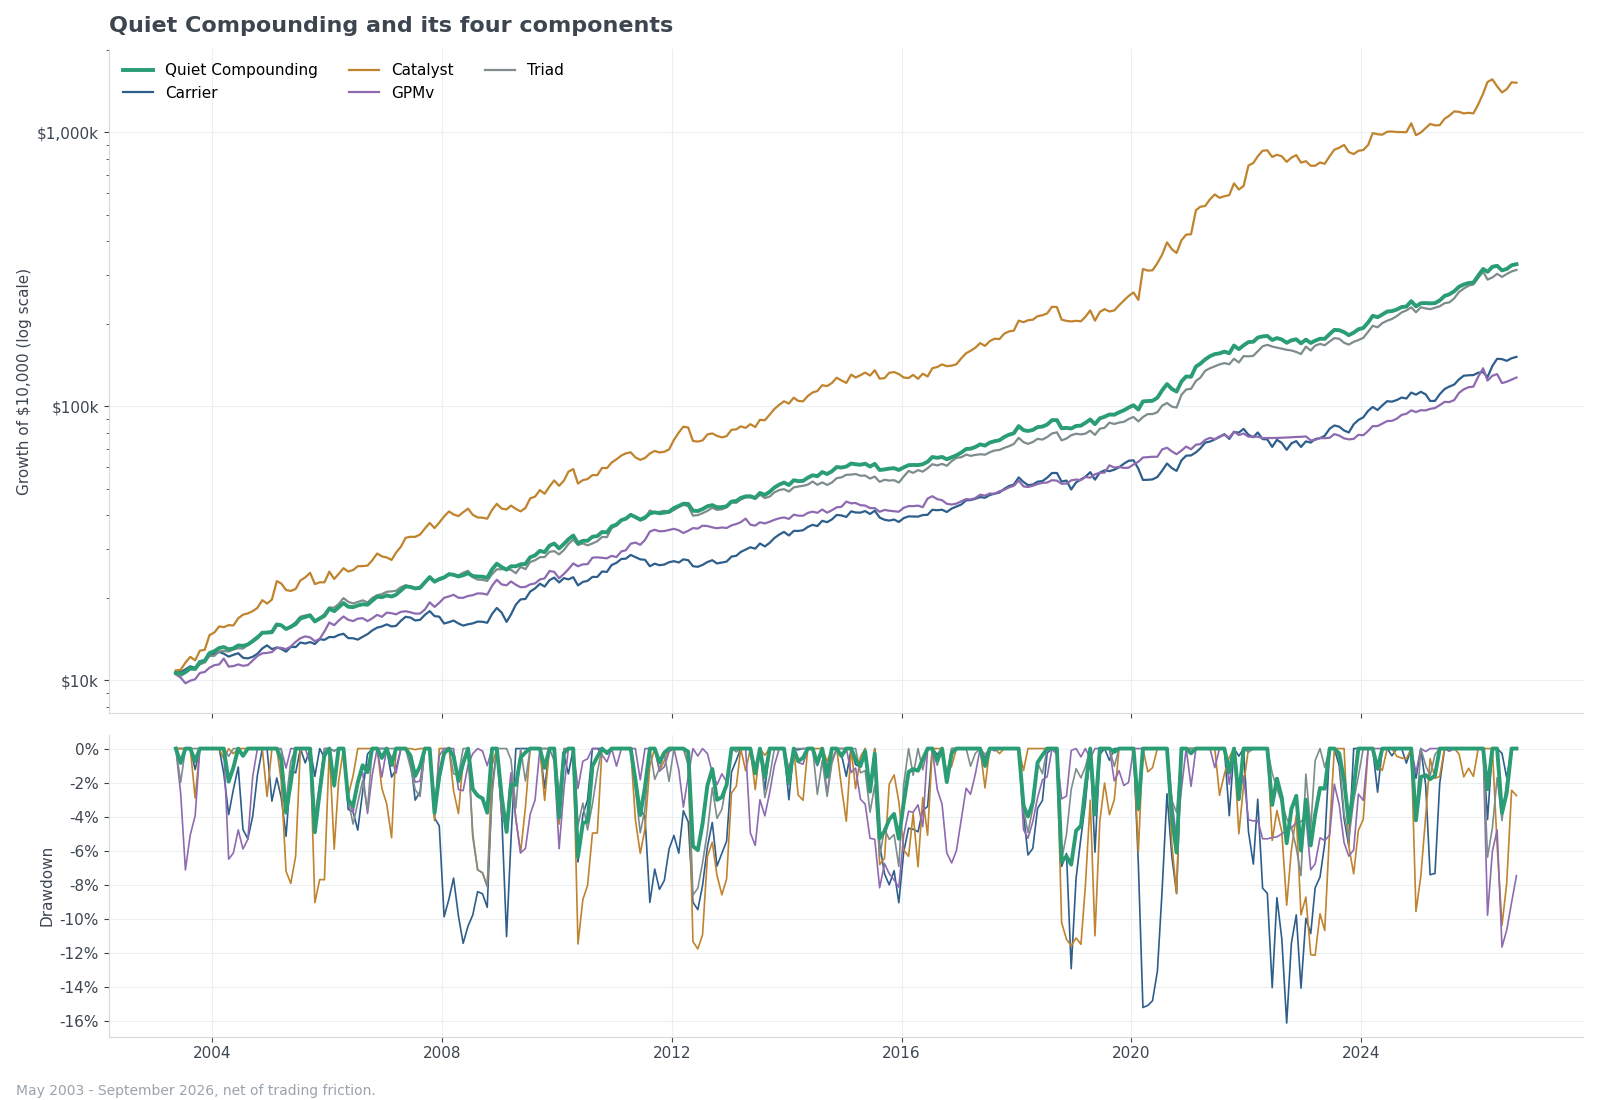
Quiet Compounding finishes second in growth, behind the growth engine Catalyst, and ahead of Triad, Carrier and GPMv. That is about what you would expect from an average of four things.
The drawdown panel is where it stops behaving like an average. Every component has a drawdown deeper than Quiet Compounding's worst. Carrier went to -16%, Catalyst to -12%, GPMv to -12%, Triad to -9%. The blend's line sits above all of them almost the whole way.
| CAGR | Max DD | Ulcer Index | UPI | Sharpe | Sortino | |
|---|---|---|---|---|---|---|
| Quiet Compounding | 16.1% | -6.8% | 2.03 | 7.13 | 1.53 | 3.52 |
| Carrier | 12.3% | -16.1% | 4.69 | 2.28 | 0.97 | 1.91 |
| Catalyst | 23.9% | -12.2% | 4.10 | 5.43 | 1.30 | 3.10 |
| GPMv | 11.5% | -11.7% | 3.09 | 3.19 | 1.08 | 2.39 |
| Triad | 15.9% | -8.6% | 2.30 | 6.18 | 1.46 | 3.31 |
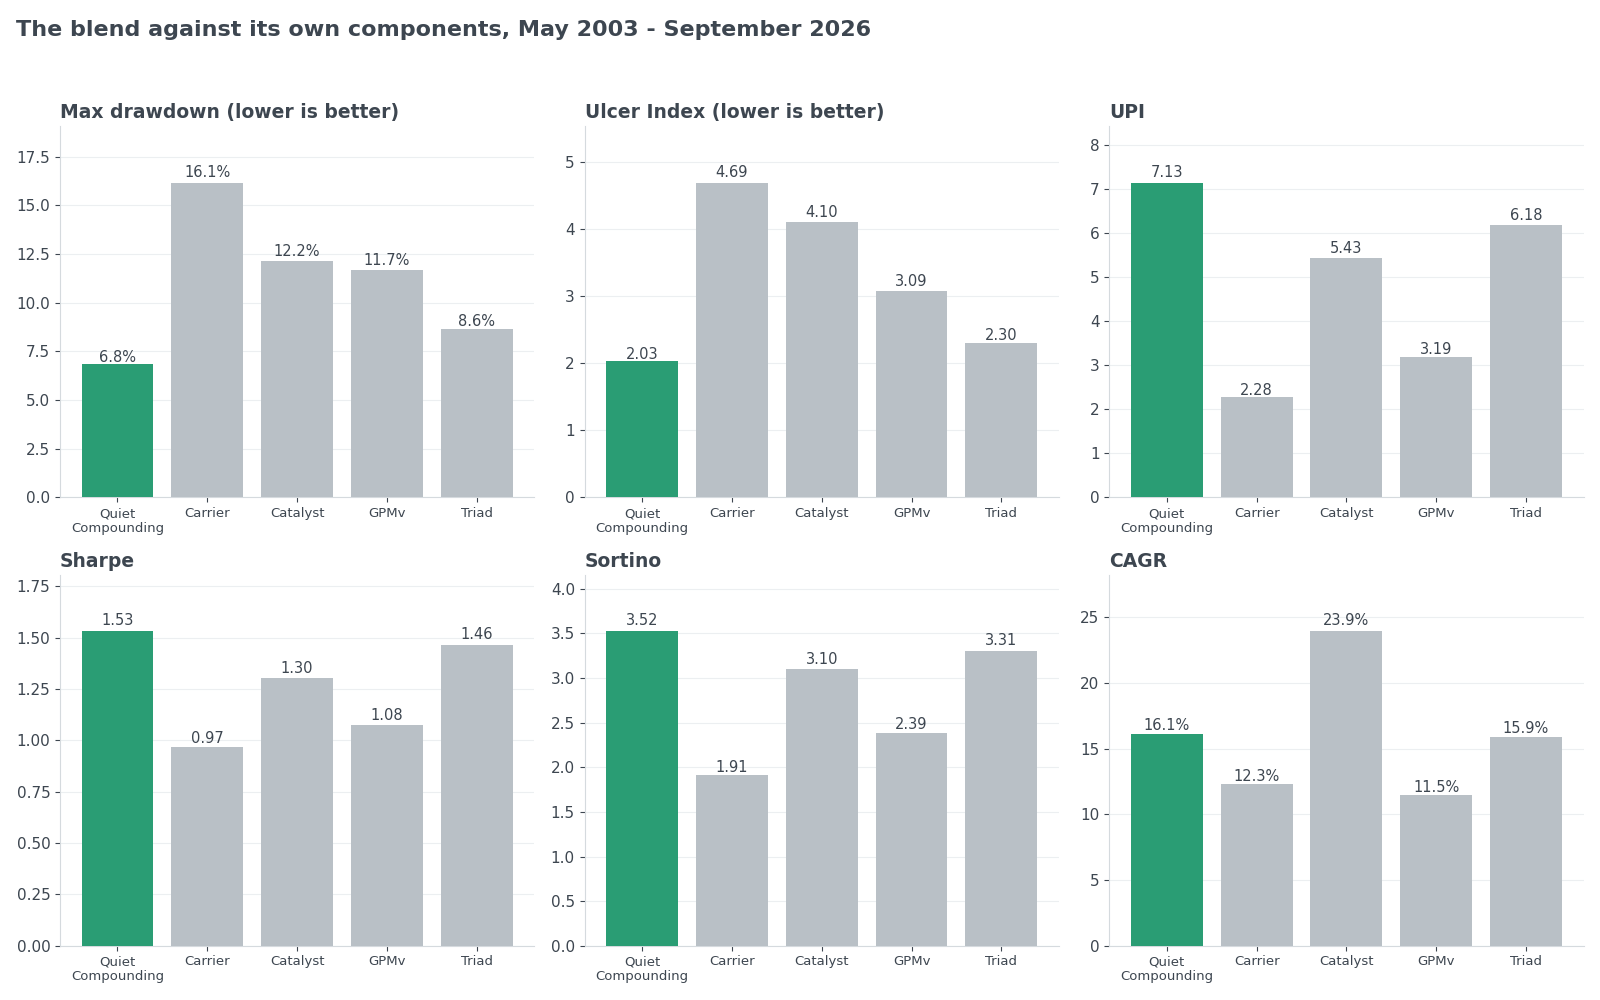
Quiet Compounding beats every one of its components on maximum drawdown, Ulcer Index, UPI, Sharpe and Sortino. Not most of them. All four, on all five metrics.
The obvious challenge is Catalyst. It compounded at 23.9% unleveraged, nearly eight points a year better than the blend, so why not just own Catalyst? Because it got there with twice the drawdown pain. Its Ulcer Index is 4.10 against 2.03, and once you divide return by that pain, its UPI of 5.43 falls well short of the blend's 7.13. Catalyst wins on raw returns but nothing else.
There is one measure where a component comes close: GPMv's annualized volatility matches the blend's at 9.0%, and GPMv earns nearly five fewer points a year to get it.
The Ulcer Index measures the downside pain of an investment strategy, its result is the one that makes the strongest argument for Quiet Compounding. The average Ulcer Index of the four components is 3.55. If combining them simply averaged their pain, the blend would sit near that. Instead it comes in at 2.03, below even the best single component. That is only possible if the components are hurting at different times.
Why it works: a different engine for each crisis
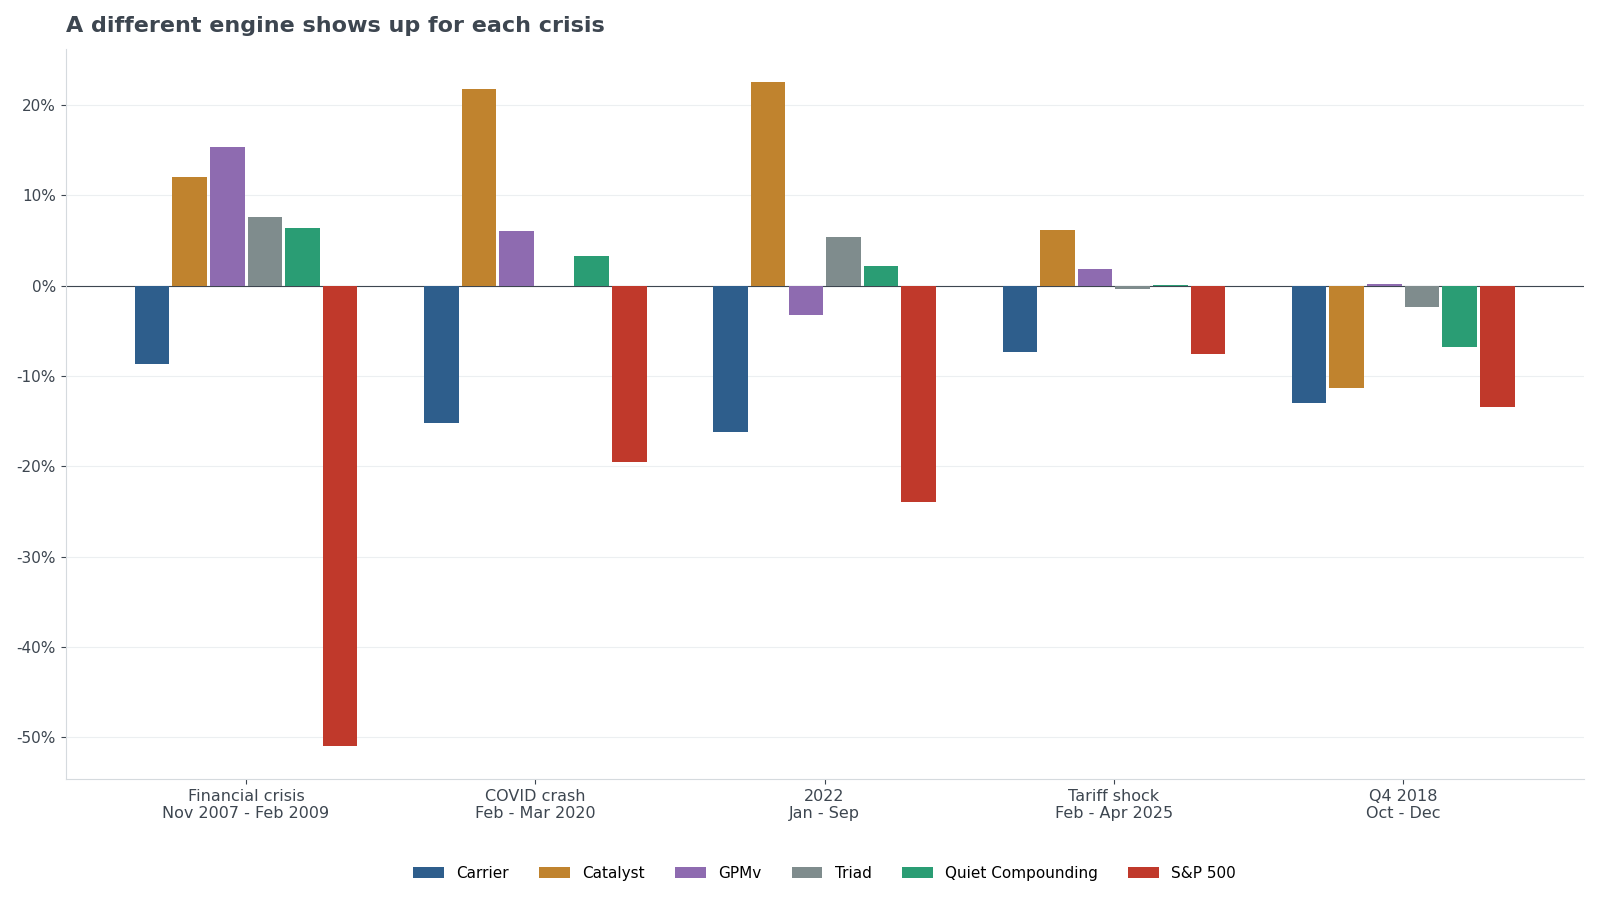
The four components are related but far from interchangeable. Their monthly correlations to one another run from 0.35 to 0.64, and their correlations to the S&P 500 range from 0.21 for GPMv to 0.78 for Carrier.
That shows up clearly in the stress windows, because a different component carried the portfolio in each one:
- Financial crisis, Nov 2007 - Feb 2009. GPMv was the hero at +15.4%, with Catalyst at +12.0% and Triad at +7.6%. Carrier lost 9%. Quiet Compounding finished +6.4% while the S&P 500 lost 51%.
- COVID crash, Feb - Mar 2020. Catalyst gained 21.8% while Carrier lost 15%. The blend was up 3.3%.
- 2022, Jan - Sep. The year stocks and bonds fell together, and 60/40 lost 20%. Catalyst gained 22.5% and Triad 5.4%, more than covering Carrier's 16% loss. Quiet Compounding was up 2.1%.
- 2025 tariff shock, Feb - Apr. Catalyst and GPMv offset Carrier. The blend was flat while the S&P 500 lost 7.6%.
Carrier is the component that gets hurt in nearly every one of these, which might make you wonder why it is there. Look at the recoveries. Carrier returned 29.0% in 2009, 28.4% in 2013, 27.3% in 2019 and 25.5% in 2023. It is the component built to stay invested in growth, and it pays for its place in the years after a selloff, exactly when the defensive engines are slow to come back.
Q4 2018 was a time frame that didn't work as well, it produced Quiet Compounding's worst drawdown, -6.8%. The selloff was sharp enough to catch Carrier (-12.9%) and Catalyst (-11.4%) at the same time, and only GPMv and Triad held up. The blend lost about as much as 60/40 that quarter. Diversification across signals reduces the odds of everything breaking at once. It does not eliminate them, and 2018 is the reminder. The overall benefit of combining these four strategies is that the portfolio is more robust and resilient than any of the individual strategies on their own.
Year by year
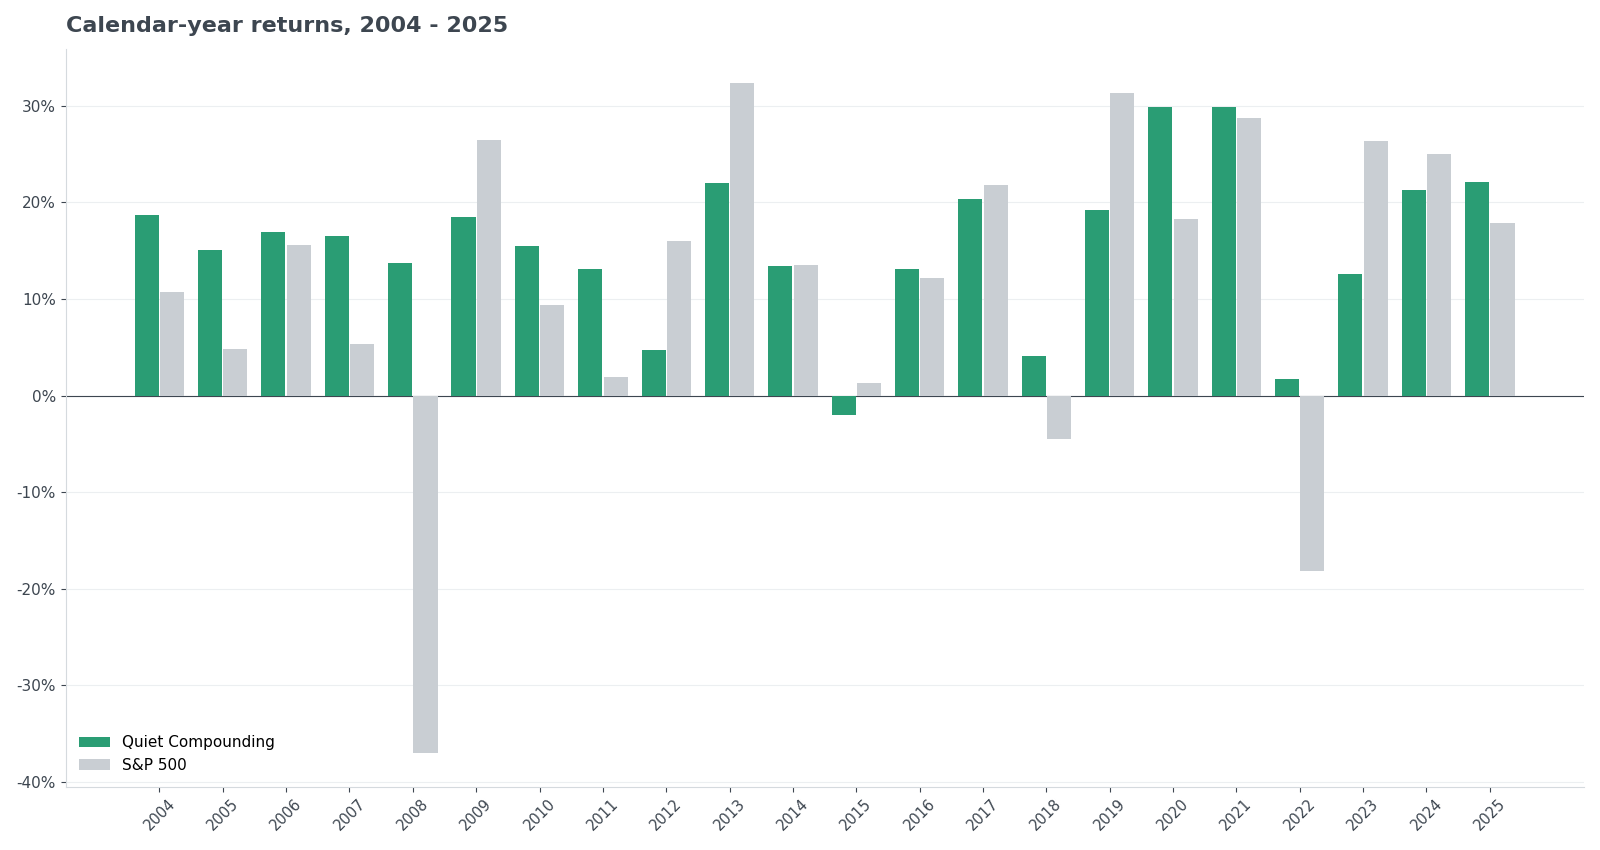
One losing calendar year since 2003: 2015, at -2.0%. The years it lagged are mostly strong equity years like 2013, 2019 and 2023, when the S&P 500 returned 26% to 32% and Quiet Compounding returned 12% to 22%. That is the trade, and it is a deliberate one. A portfolio built not to fall with the market will not keep pace with it in its best years.
What I take from it
First, combining strategies beats picking the best one. Catalyst had the highest return, Triad the best risk-adjusted numbers on its own. The blend beat both on every risk measure, because its components rarely fail together. That is the whole thesis of Quiet Compounding.
Second, the components are the source of everything. The blend is only as good as the independence of its parts. If Carrier and Catalyst had been more alike, Q4 2018 would have been the template rather than the exception.
Third, this is not a tax-efficient portfolio. GPMv, Catalyst and Triad all trade on monthly signals, and most of what Quiet Compounding realizes will be short-term gains. It belongs in a tax-advantaged account if you have the choice.
Fourth, there is hindsight in every number above. I chose these four components and their weights knowing how they performed. Catalyst's regime thresholds were set recently. Carrier's managed futures and long/short holdings rely on proxy data before DBMF launched in 2019 and before 2010 for CLSE. And this exact four-way mix has essentially no live record yet. Read the 23-year history as evidence that the design idea is sound, not as a forecast of 16.1% a year. But in fairness, I also didn't try to optimize the mix of these strategies, I equal weighted them instead.
What I would say with confidence is narrower. Four engines that read credit spreads, inflation, trend and momentum do not tend to break in the same month. When they don't, a plain 25% each, rebalanced once a year, is enough to turn four bumpy rides into a smooth one.
You can see Quiet Compounding's full record, current allocation and every component on its strategy page, and run any of these comparisons yourself over whatever window you like.
Past performance, including backtested results, is not indicative of future results. Backtested performance is hypothetical, does not reflect actual trading, and benefits from hindsight in the selection of strategies, holdings and weights. Portions of the history rely on reconstructed proxy data for funds that did not exist for the full period, and managed futures and hedge fund index data is subject to survivorship and backfill bias. Third-party strategies are implemented from published descriptions and any implementation error is mine, not the authors'.