Seven Canaries and Three Sleeves: Keller & Keuning vs Triad
Wouter Keller and Jan Willem Keuning have done something unusual in this business. They published their rules. Not a marketing summary of their rules, not a black box with a performance chart attached, but complete, implementable specifications that anyone with data and patience can code up and test. VAA, DAA, PAA, GPM, BAA, HAA. Fifteen years of papers, each one trying to improve on the previous.
I have implemented seven of their strategies into the DMS engine, and they run every month alongside my own strategies, on the same data, with the same trading friction applied. If you are going to claim your strategy is good, you should be willing to line it up against the best published work out there and show the result either way.
So here is the result either way.
The lineup
| What it is | |
|---|---|
| VAA Aggressive | The original. Scores four assets, goes 100% into the strongest, steps entirely aside if any one of the four is negative. |
| PAA | Scales into cash as breadth deteriorates, rather than flipping all at once. Holds the six strongest of twelve. |
| GPM | Discounts momentum by correlation. A strong asset that moves with everything else scores lower than a strong asset that moves on its own. |
| DAA | Two dedicated canary assets it never actually holds. Both healthy, fully invested. One sick, half defensive. Both sick, all defensive. |
| BAA Balanced | Four canaries, all must be positive. Six of twelve offensive assets when healthy, three of seven defensive when not, with every defensive pick required to beat T-bills. |
| BAA Aggressive | Same machinery, concentration turned all the way up. One asset, one hundred percent, when the canaries are clear. |
| HAA | A single canary, four equal-weighted picks from a global eight, each pick individually swapped out if it has lost its own momentum. |
And Triad, which does none of that. Three sleeves, 30/35/35 nominal, each combining relative and absolute momentum, each retreating to intermediate Treasuries on its own signal without asking the other two for permission. Weights are allowed to drift until any sleeve is five points off its nominal, at which point the it re-balances to nominal weights.
That difference in architecture turns out to explain most of what follows.
Ground rules
Everything below runs through the same engine, on the same waterfall return series, net of the same 10 bps one-way friction. There are two time periods in this piece and it is worth being clear about which is which.
The full record is February 1980 through August 2026, 559 months or 46.6 years. Every strategy here has data for all of it, so the decade tables and the since-inception figures are like-for-like over the whole span. That span covers Volcker and the 1980-82 double dip, the 1987 crash, 1990, the 1994 bond rout, Asia and LTCM in 1998, the dot-com bust, 2008, 2022, and the run since. It is a meaningfully harder test than starting in 2000, and it is the window on which Triad does not have the best raw return.
Where I show a single side-by-side table of metrics, the window is January 2000 through August 2026, 320 months or 26.7 years. There is nothing magic about that start date. It splits the record roughly in half and it is the range the detailed metrics were compiled over. It is also the more flattering half for my side of the argument, which is exactly why the decade breakdown below runs the whole way back rather than stopping where the story gets good for me.
One thing I want to say plainly before the numbers, because it cuts against my own case as much as anyone's. Every strategy here, mine included, had its asset universe chosen with the benefit of hindsight. Keller & Keuning are unusually honest about this and say so in their own papers. I am saying it about Triad too. Backtests flatter everybody, and the right way to read what follows is as a comparison of how these approaches behaved under the same conditions, not as a forecast.
Give them the win first
Let us start with the number people look at first, and let us start with the case against Triad.
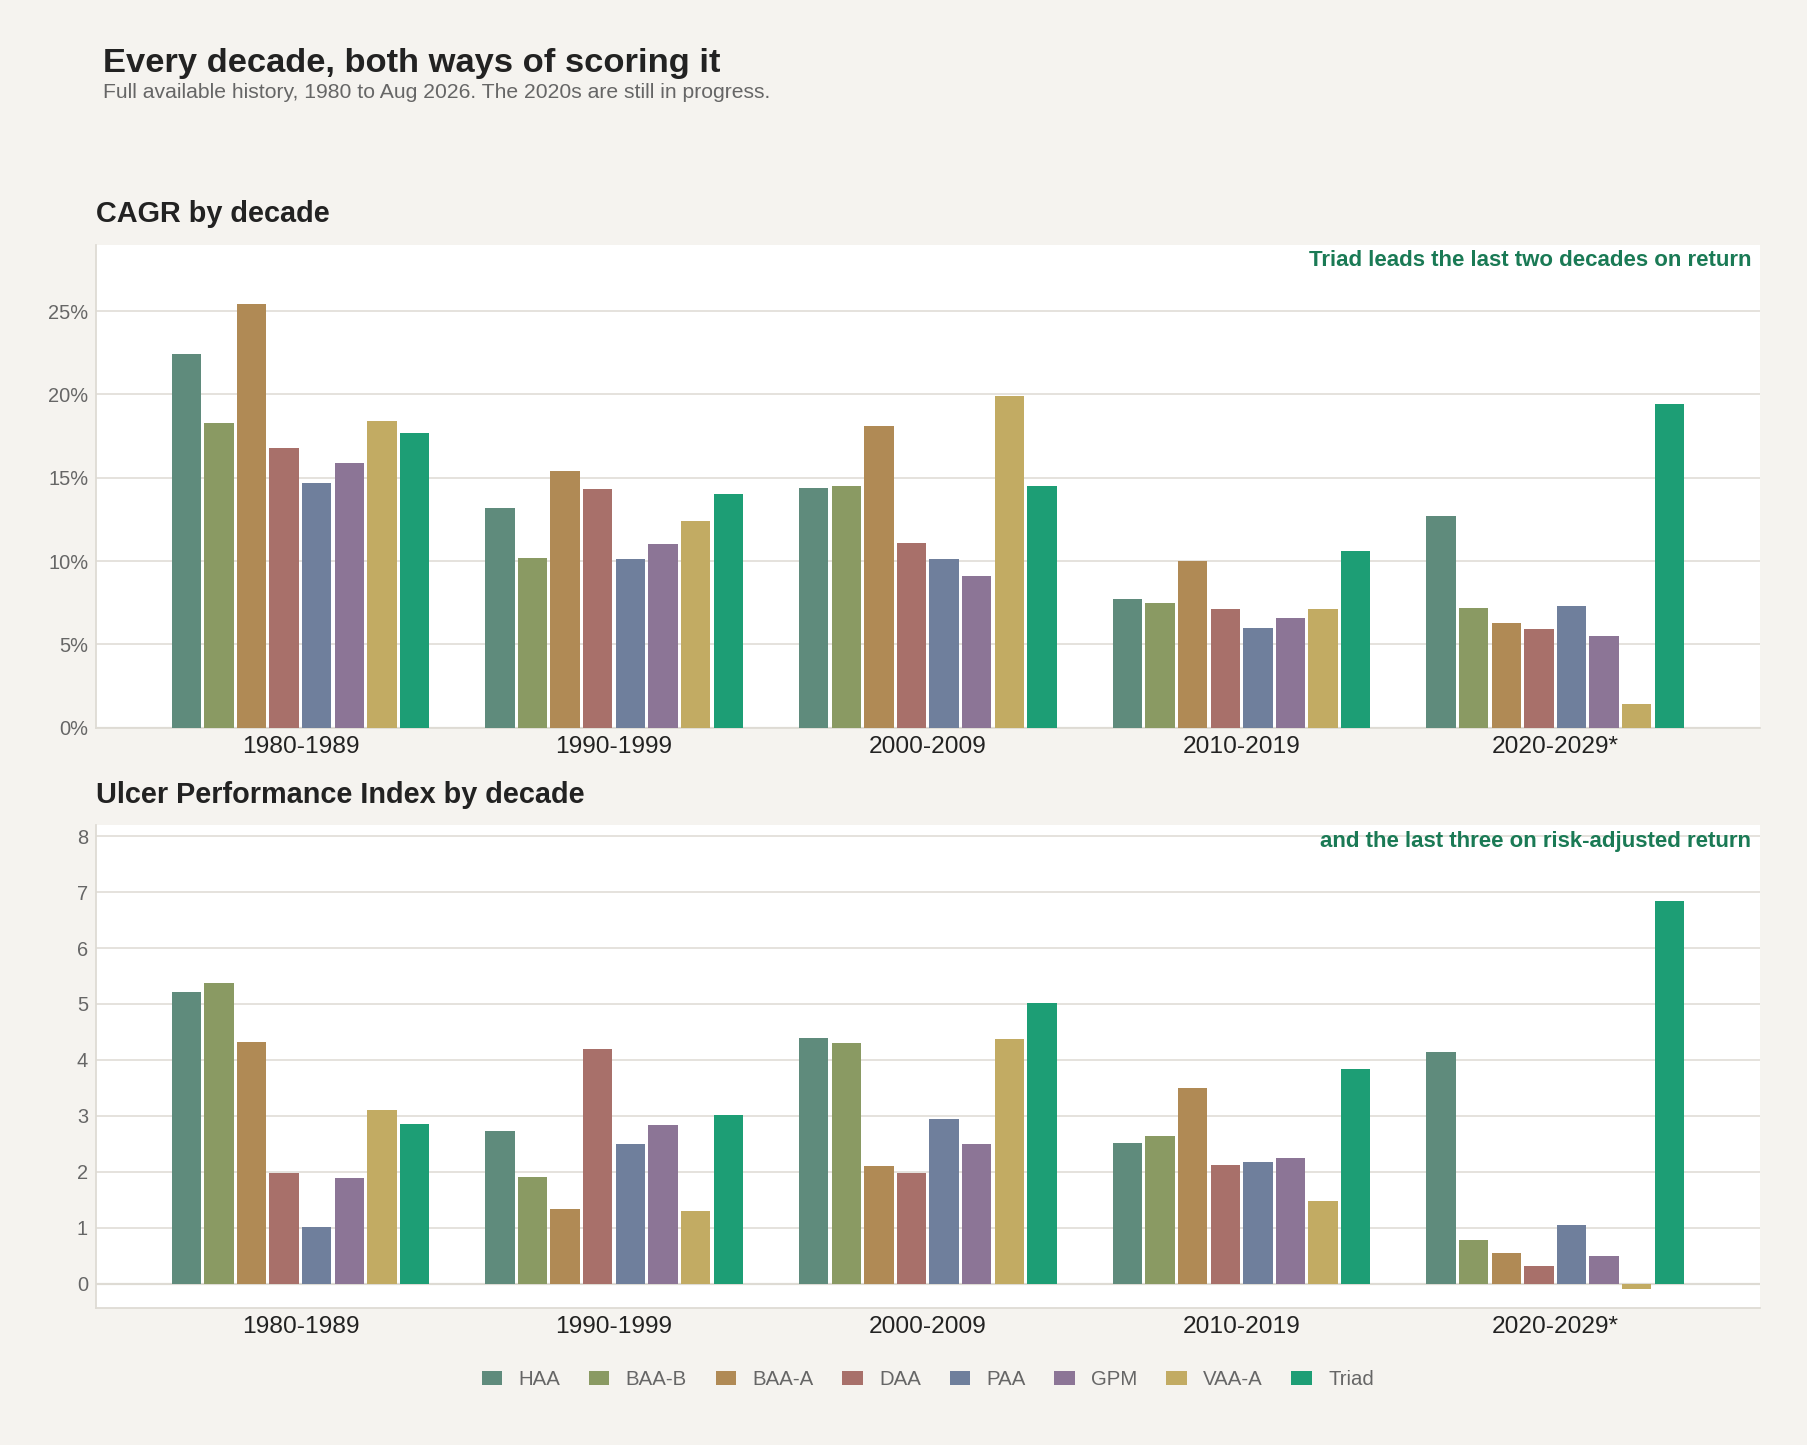
Measured over each strategy's full available history back to 1980, BAA Aggressive compounded at 15.42% against Triad's 14.88%. That is not a rounding error. It is a half point a year for forty-six years, and over that span half a point a year is a lot of money.
Go decade by decade and the first half of the record gets worse for me before it gets better.
| CAGR | 1980s | 1990s | 2000s | 2010s | 2020s* |
|---|---|---|---|---|---|
| HAA | +22.4% | +13.2% | +14.4% | +7.7% | +12.7% |
| BAA Balanced | +18.3% | +10.2% | +14.5% | +7.5% | +7.2% |
| BAA Aggressive | +25.4% | +15.4% | +18.1% | +10.0% | +6.3% |
| DAA | +16.8% | +14.3% | +11.1% | +7.1% | +5.9% |
| PAA | +14.7% | +10.1% | +10.1% | +6.0% | +7.3% |
| GPM | +15.9% | +11.0% | +9.1% | +6.6% | +5.5% |
| VAA Aggressive | +18.4% | +12.4% | +19.9% | +7.1% | +1.4% |
| Triad | +17.7% | +14.0% | +14.5% | +10.6% | +19.4% |
In the 1980s Triad finishes fifth of eight. BAA Aggressive beat it by nearly eight points a year and HAA by nearly five. The 1990s are better but still third. The 2000s are a near tie for third, with VAA Aggressive putting up a remarkable 19.9%.
Then it flips. Triad wins the 2010s and wins the 2020s so far by a large margin, +19.4% against HAA's +12.7% and BAA Aggressive's +6.3%. I would treat the 2020s row with caution, since it is a partial decade and six and a half years is not a sample, but the 2010s row is a full ten years and Triad is first in it.
Now score the same decades on Ulcer Performance Index, which is the measure DMS prioritizes.
| UPI | 1980s | 1990s | 2000s | 2010s | 2020s* |
|---|---|---|---|---|---|
| HAA | 5.21 | 2.73 | 4.39 | 2.51 | 4.13 |
| BAA Balanced | 5.38 | 1.91 | 4.30 | 2.63 | 0.77 |
| BAA Aggressive | 4.31 | 1.33 | 2.10 | 3.50 | 0.54 |
| DAA | 1.97 | 4.20 | 1.98 | 2.11 | 0.31 |
| PAA | 1.01 | 2.49 | 2.95 | 2.18 | 1.04 |
| GPM | 1.89 | 2.83 | 2.49 | 2.25 | 0.49 |
| VAA Aggressive | 3.10 | 1.30 | 4.38 | 1.47 | -0.09 |
| Triad | 2.85 | 3.01 | 5.02 | 3.84 | 6.84 |
Triad is fifth in the 1980s, second in the 1990s, and first in each of the last three decades. Note the 2020s column in particular. Six of the seven Keller & Keuning models are below 1.10, and VAA Aggressive is negative, meaning it has not been paid at all for the time it has spent underwater. HAA is the only one clear of the pack at 4.13. Triad is at 6.84.
So the honest summary of the decade data is this. The Keller & Keuning models had a genuinely better first two decades than Triad did, BAA Aggressive emphatically so. They have not had a better one since.
Rolled up, the modern era looks like this.
| Jan 2000 - Aug 2026 | CAGR | Max DD | Ulcer | UPI |
|---|---|---|---|---|
| HAA | +11.5% | -9.6% | 2.70 | 3.56 |
| BAA Balanced | +9.9% | -11.4% | 3.79 | 2.12 |
| BAA Aggressive | +11.9% | -19.0% | 5.86 | 1.71 |
| DAA | +8.3% | -20.2% | 6.17 | 1.04 |
| PAA | +7.9% | -11.0% | 3.15 | 1.90 |
| GPM | +7.2% | -11.7% | 3.72 | 1.44 |
| VAA Aggressive | +10.2% | -21.6% | 7.67 | 1.09 |
| Triad | +14.2% | -8.6% | 2.49 | 4.93 |
| 60/40 | +6.7% | -32.4% | 7.64 | 0.63 |
Over twenty-six and a half years including three real bear markets, Triad led on return and had the smallest drawdown of the nine. BAA Aggressive gave up three and a half points of annual return relative to the 1980s and 1990s version of itself, and kept all of the risk.
Which framing is the honest one? Both, and that is the point. The 1980s and 1990s were an extraordinary environment for a strategy that concentrates hard into whatever is strongest, and BAA Aggressive banked enough there to still be ahead of Triad on the forty-six-year number. The last twenty-six years have been a different environment, and it has not gone as well for that design.
The chart that ends most of the argument
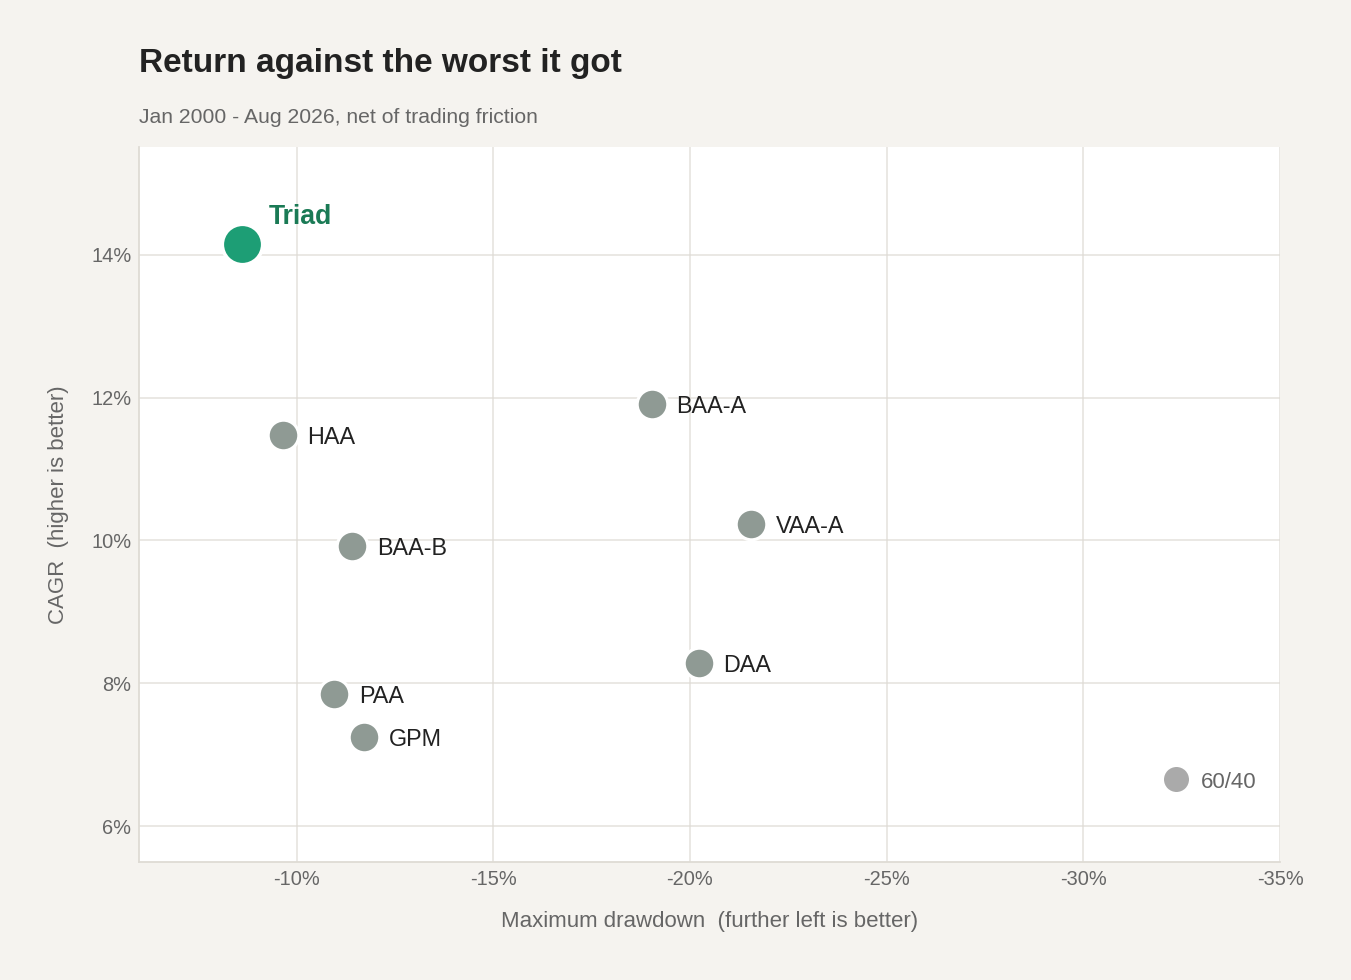
Up and to the left is where you want to be. Triad is alone up there. HAA is the only other model in the neighborhood, and it is the one I respect most of the seven by a wide margin.
Notice the two on the right. VAA Aggressive and DAA took drawdowns of 21.6% and 20.2% to earn 10.2% and 8.3%. They are not being paid for the risk they are running. BAA Aggressive at least gets something for it, 11.9% at a 19.0% drawdown, but it is still trading a lot of pain for less return than Triad delivered at less than half the drawdown.
Four ways of asking the same question
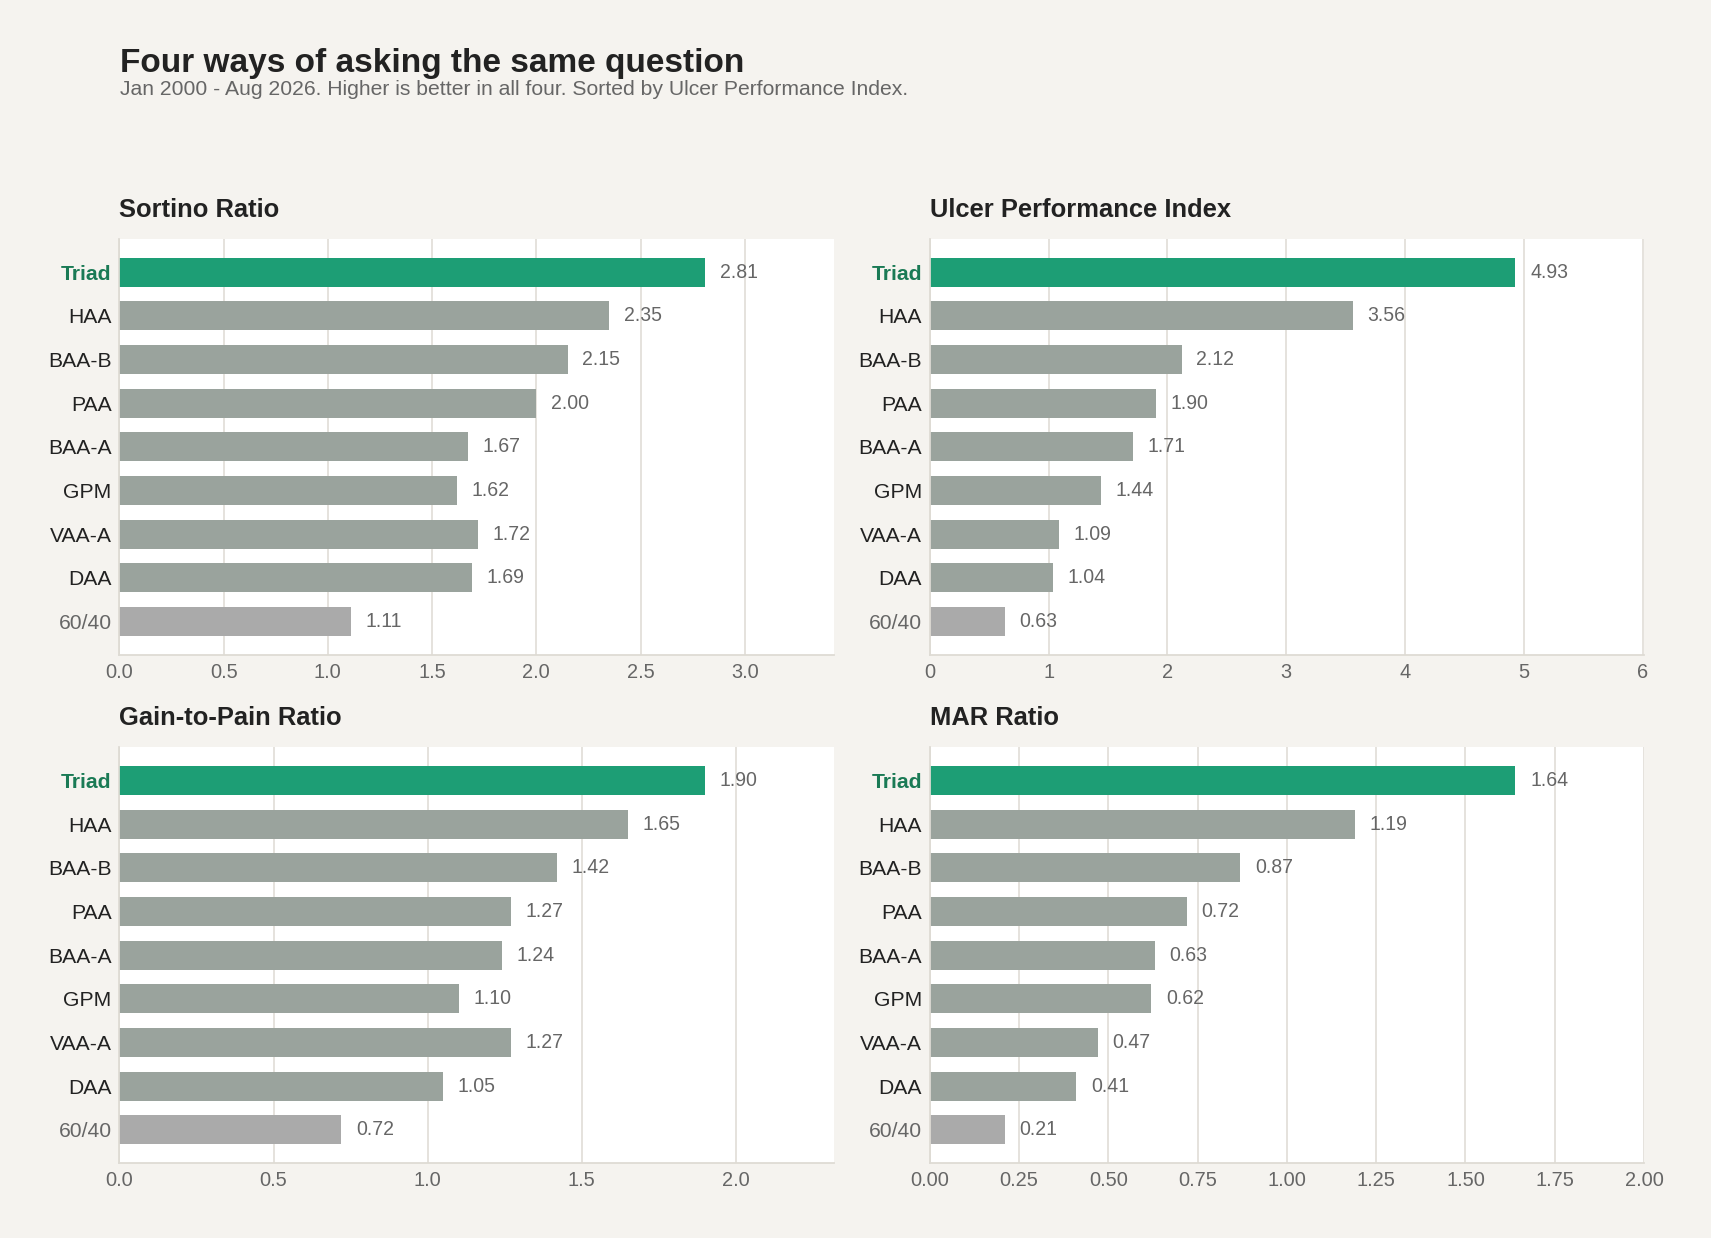
DMS has always been about risk-adjusted return rather than focusing on headline CAGR, so this is the section that actually matters the most to me.
| Jan 2000 - Aug 2026 | Sortino | UPI | Gain-to-Pain | MAR |
|---|---|---|---|---|
| HAA | 2.35 | 3.56 | 1.65 | 1.19 |
| BAA Balanced | 2.15 | 2.12 | 1.42 | 0.87 |
| BAA Aggressive | 1.67 | 1.71 | 1.24 | 0.63 |
| DAA | 1.69 | 1.04 | 1.05 | 0.41 |
| PAA | 2.00 | 1.90 | 1.27 | 0.72 |
| GPM | 1.62 | 1.44 | 1.10 | 0.62 |
| VAA Aggressive | 1.72 | 1.09 | 1.27 | 0.47 |
| Triad | 2.81 | 4.93 | 1.90 | 1.64 |
| 60/40 | 1.11 | 0.63 | 0.72 | 0.21 |
Four different measures, four different definitions of risk, same ordering at the top. Triad first, HAA second, and a gap after that.
You will notice Sharpe is not in there. Sharpe treats a big up month as risk, exactly the same as a big down month, Sortino fixes that by counting only downside deviation. UPI and MAR both work off the drawdown itself, UPI weighting depth and duration together, MAR just dividing return by the worst of it. Gain-to-Pain, which is Jack Schwager's, adds up every month you made and divides by everything you gave back, so a reading of 1.90 means Triad earned 1.90 points of net gain for each point it ever lost. Different arithmetic, same question: what did the return cost you to sit through.
UPI is the one I weight most heavily, because it is the only one of the four that penalizes a strategy for how long it stays underwater rather than just how deep it went. Triad's 4.93 against HAA's 3.56 and BAA Aggressive's 1.71 is not a close call.
How the trip felt
Averages hide the experience. This is the part of a strategy you actually have to live with.
| Jan 2000 - Aug 2026 | Positive months | Worst month | Months to bottom | Months to recover |
|---|---|---|---|---|
| HAA | 65.6% | -8.2% | 5 | 2 |
| BAA Balanced | 65.3% | -6.8% | 36 | 6 |
| BAA Aggressive | 65.3% | -13.7% | 7 | 29 |
| DAA | 63.4% | -7.1% | 18 | 31 |
| PAA | 65.0% | -5.8% | 23 | 12 |
| GPM | 62.5% | -9.2% | 4 | - |
| VAA Aggressive | 62.2% | -9.8% | 19 | - |
| Triad | 67.8% | -7.7% | 2 | 8 |
| 60/40 | 65.0% | -11.3% | 16 | 24 |
Triad's worst drawdown of the period took two months to happen and eight to repair. BAA Aggressive's took seven months to happen and twenty-nine to repair, which is nearly three years of being behind. DAA spent eighteen months going down and thirty-one coming back, a four-year round trip. Those two dashes in the recovery column are strategies still working their way back.
Two and a half years of being underwater is where people quit strategies. Not at the bottom, in the long flat grind afterward. A model that goes down fast and comes back fast is easier to actually hold than one with a shallower maximum drawdown spread over four years, even if a spreadsheet scores them similarly.
Why the difference is structural, not lucky
I do not think Triad's edge here is a data artifact. I think it follows from one design decision.
The real difference is not whether risk comes off in steps, but where the decision gets made. All of the Keller & Keuning strategies set a single portfolio-level dial from one universe-wide reading: a canary pair, a canary quartet, a breadth count. One judgment about the state of the world, applied to everything the strategy owns. Triad has no single overiding control. Three sleeves each decide independently about their own asset allocation on their own signal, and nothing coordinates them. Defensive weight is not a setting, it is whatever falls out of three independent calls that were never consulted with each other. Historically some defensive weight has been on in about 41% of months, averaging around 16% of the portfolio, and Triad has been fully defensive in only 8 months across 46 years. That costs return in a year when the right answer was to be all-in. It buys back more than it costs in the years when the reading of the world was wrong, and the reading is wrong reasonably often. BAA sits defensive in roughly 60% of months by design.
Does the record support any of that mattering? Partly, the two deepest drawdowns in the comparison belong to the two most binary models, VAA Aggressive at -21.6% and BAA Aggressive at -19.0%. But BAA Balanced is just as binary and came through at -11.4%, while DAA scales in three steps and still took -20.2%. Granularity helps at the margin. It does not rescue a model whose one reading of the world was wrong, and DAA's two canaries can be wrong together.
The other structural difference is where the bonds live. In VAA, and in BAA Aggressive's four-asset offensive set, aggregate bonds are an offensive holding. So the strategy can be fully risk-on holding nothing but bonds, and a bond selloff counts as a warning signal about equities. 2022 tested that arrangement and you can see the result in the 5-year column below.
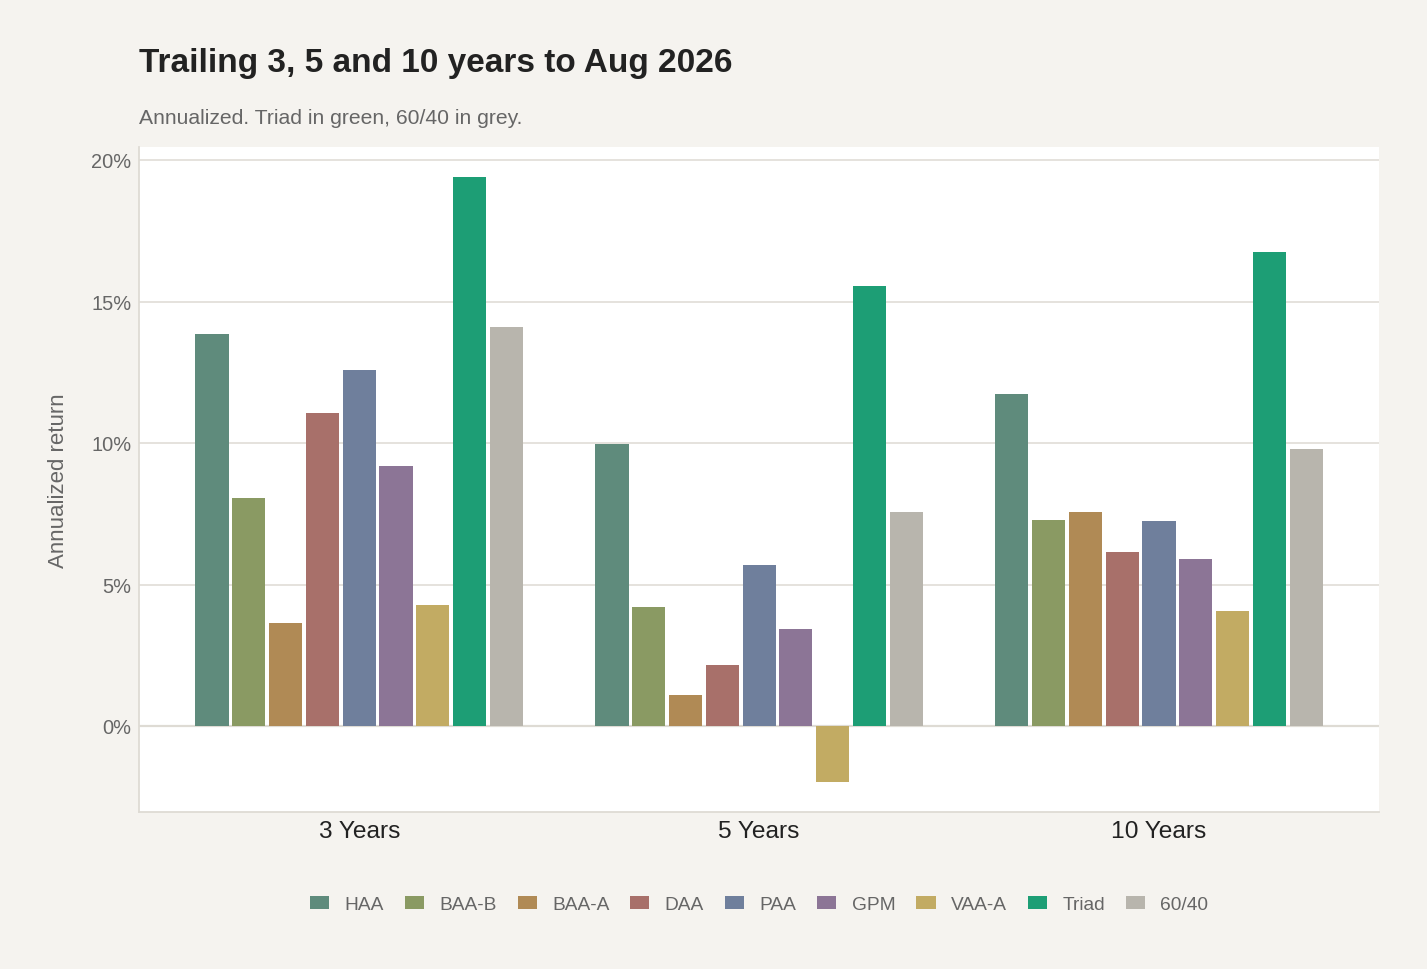
| To Aug 2026 | 3 Years | 5 Years | 10 Years |
|---|---|---|---|
| HAA | +13.9% | +10.0% | +11.8% |
| BAA Balanced | +8.1% | +4.2% | +7.3% |
| BAA Aggressive | +3.7% | +1.1% | +7.6% |
| DAA | +11.1% | +2.2% | +6.2% |
| PAA | +12.6% | +5.7% | +7.2% |
| GPM | +9.2% | +3.4% | +5.9% |
| VAA Aggressive | +4.3% | -2.0% | +4.1% |
| Triad | +19.4% | +15.6% | +16.7% |
| 60/40 | +14.1% | +7.6% | +9.8% |
VAA Aggressive is negative over five years. BAA Aggressive is barely positive. A plain 60/40 beat six of the seven over that span. To be fair to Keller & Keuning, they identified this exact problem themselves, and BAA's rule that a defensive holding must outrun T-bills before it can be held is, to my eye, the single most durable idea in the whole family. It just did not go far enough.
They are not really substitutes
One number that argues against reading this as a beauty contest. Over the same window, Triad's correlation to these strategies runs from 0.42 to 0.69.
| Correlation to Triad | |
|---|---|
| HAA | 0.69 |
| BAA Balanced | 0.64 |
| PAA | 0.64 |
| DAA | 0.61 |
| GPM | 0.56 |
| BAA Aggressive | 0.55 |
| VAA Aggressive | 0.42 |
| 60/40 | 0.37 |
Nothing here is above 0.70. These are genuinely different return streams, not seven versions of the same trade. If you already hold one of the Keller & Keuning models and you like it, that is a perfectly reasonable thing to keep holding, and pairing it with Triad is a more interesting proposition than replacing it.
The tax problem nobody mentions
Every strategy in this comparison belongs in a tax-deferred account, mine included, and I would rather say that plainly than let someone find out the expensive way.
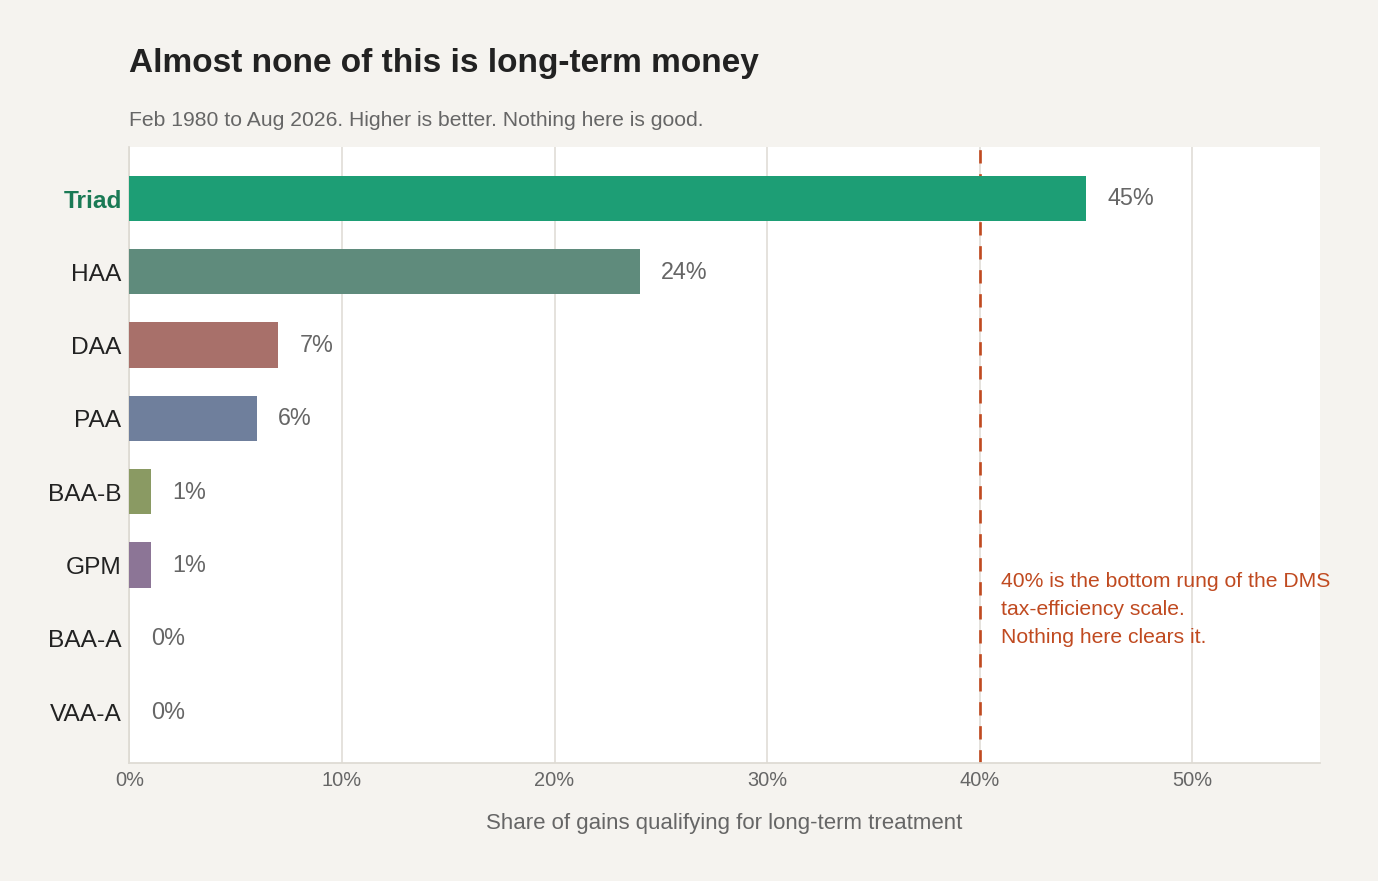
| Feb 1980 - Aug 2026 | Gains qualifying as long-term |
|---|---|
| Triad | 45% |
| HAA | 24% |
| DAA | 7% |
| PAA | 6% |
| BAA Balanced | 1% |
| GPM | 1% |
| BAA Aggressive | 0% |
| VAA Aggressive | 0% |
The reason is mechanical. The Keller & Keuning models rebalance to fresh target weights every month whether the signals changed or not, so a position almost never survives twelve months at the same size. Four of the seven are effectively pure short-term gain machines. BAA Aggressive and VAA Aggressive round to zero, BAA Balanced and GPM to one percent. Every dollar of profit taxed at your ordinary income rate, every year, forever.
Triad's drift design changes that more than I expected when I first measured it. A sleeve is traded only when its own momentum signal changes what it should own, and until then it is left alone to compound. Roughly half of all months require no trades at all. The result is that 45% of gains qualify for long-term treatment, nearly double HAA's 24% and many times over the rest of the field.
The Triad strategy page says only about 9% of sleeve exits are held long enough to qualify. Both numbers are right, because they count different things. Most exits are short holds. The minority that run past a year are disproportionately the positions that actually appreciated, since a sleeve keeps what is working and sells what is not. Few long-term exits, carrying a large share of the profit.
None of which makes Triad tax-efficient. DMS rates tax efficiency directly off this number, and 45% scores Very Poor on that scale. Everything else in this comparison scores Terrible. The honest summary is that Triad is the least bad option in a field of bad options, and that the right home for any of them is an IRA or a 401(k).
What I take from it
First, Over the full history BAA Aggressive out-returns Triad, and in the 1980s four of the models did. That advantage is real, it is just concentrated in the first half of the record. If you believe the next twenty years will look more like 1980 to 1999 than like 2000 to 2026, BAA Aggressive has a real case and I would not argue with someone who made it.
Second, that is not the trade DMS is built to make, and the last twenty-six years are where you can see what the trade actually bought. From January 2000 Triad compounded at 14.15% against 11.91% for the best of the Keller & Keuning field, and did it with the smallest maximum drawdown of the nine at -8.6%. That combination is the entire argument in one line: more return and less pain, same window, same data, same friction. This is not a case of giving up return to sleep better.
Third, every risk-adjusted measure agrees, and they agree by a margin. UPI 4.93 against HAA's 3.56. Sortino 2.81 against 2.35. MAR 1.64 against 1.19. Gain-to-Pain 1.90 against 1.65. Four different definitions of risk, four different denominators, same first and second place. That consistency matters more to me than any single figure, because a strategy that wins on one ratio has usually been fitted to that ratio. Over the full record back to 1980 the picture holds but less overwhelmingly, and I want to be precise rather than triumphant about it: scored decade by decade on Ulcer Performance Index, Triad is fifth in the 1980s, second in the 1990s, and first in each of the last three. No Keller & Keuning model finishes first on UPI in more than one decade. The place the family genuinely wins is HAA's drawdowns, where its worst decade is -9.6% against Triad's -13.8%, a number Triad took in March 1980 in the second month of its record. Ten years of doing this has convinced me the risk-adjusted number is the one that predicts whether an investor is still be following a strategy in the future.
You can run every one of these comparisons yourself on DMS, over any window you like. That was the point of building it.
Past performance, including backtested results, is not indicative of future results. Backtested performance is hypothetical, does not reflect actual trading, and benefits from hindsight in the selection of strategy rules, for the Keller & Keuning strategies and for Triad alike. Portions of the long-term history rely on reconstructed proxy data for funds that did not exist for the full period. Third-party strategies are implemented from published rules and any implementation error is mine, not the authors'.