What If You Always Bought at the High?
What If You Always Bought at the High?
Some people worry about allocating money to a strategy when the markets are at a high for the year, they may think that the backtest looks great, but will I suffer by investing at the high? Wouldn't it be prudent to wait for a dip?
It is a fair question, and the usual answers are unsatisfying. "Time in the market beats timing the market" is a slogan, not a number. So I ran the actual experiment.
The test
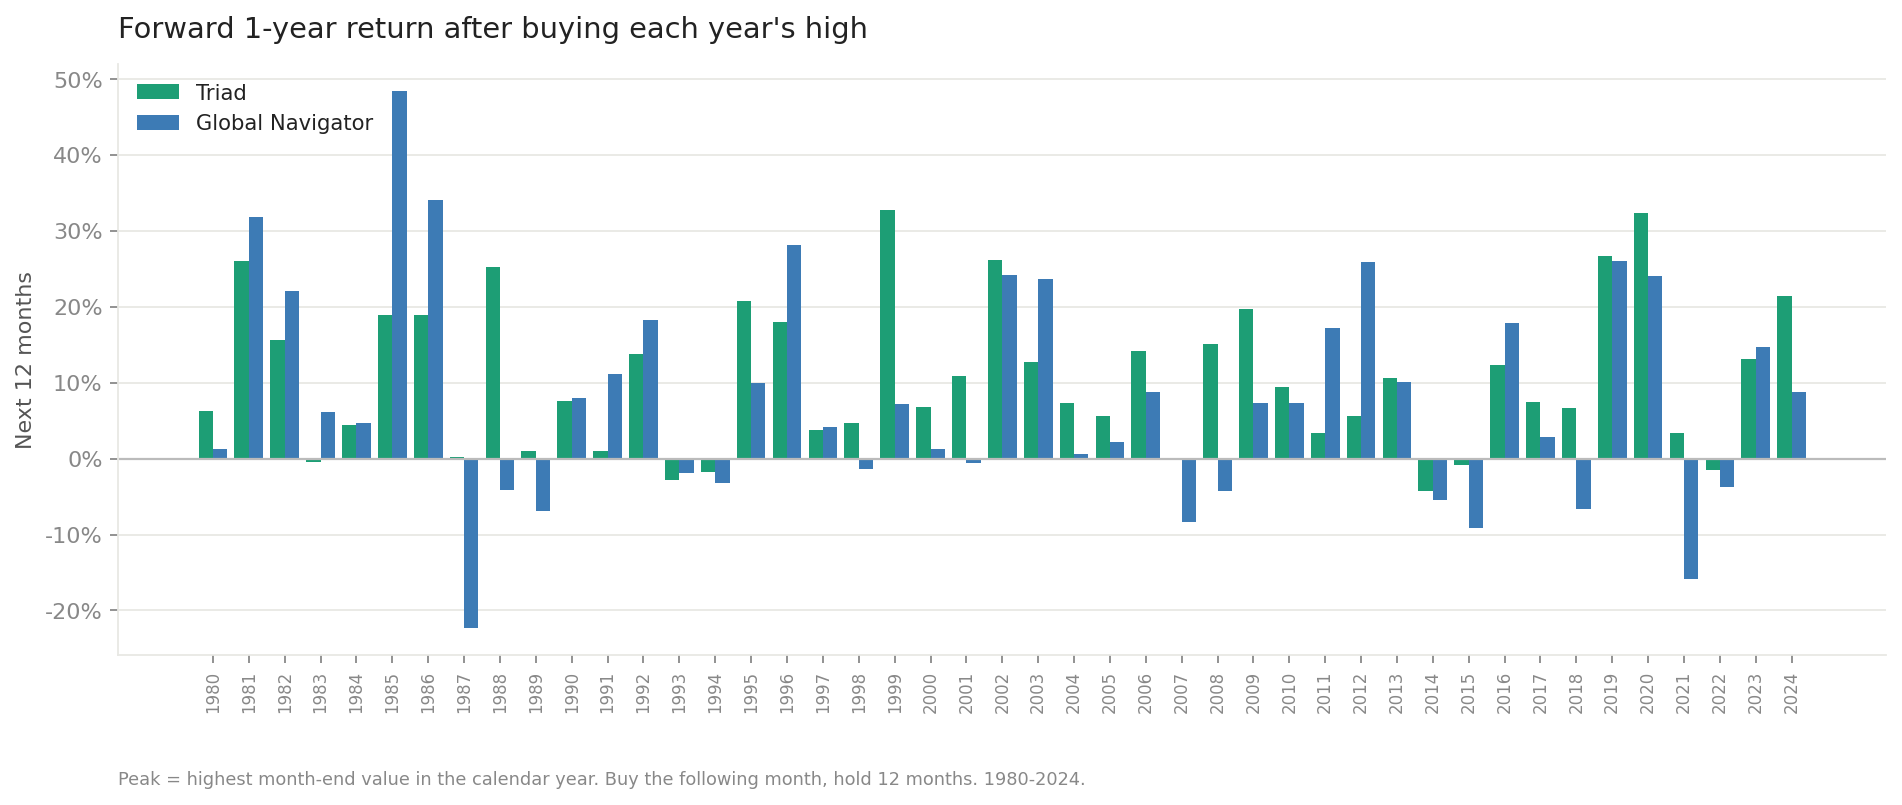
For each calendar year from 1980 through 2024, I found the month where the strategy's equity curve hit its highest point for that year. Then I pretended to invest on the first of the following month, and held for exactly twelve months.
If the 1980 high came in November, you bought in December 1980 and held through November 1981. If the 1999 high came in December, you bought in January 2000, which is to say you walked in the door at the top of the dot-com market.
Forty-five entries, every one of them the worst available entry that year. No skill, no luck, pure bad timing by construction.
Then I chained those forty-five one-year results together to get a single annualized figure.
The result
Triad returned 10.22% annualized. Global Navigator returned 7.20%.
For reference, over the same span, Triad's actual full-period CAGR is 15.40% and Global Navigator's is 14.54%. So the price of perfectly bad timing, repeated forty-five times in a row, was about 5.2 percentage points a year for Triad and about 7.3 for Global Navigator.
That is a real cost. It is not a catastrophe.
The part that matters more than the average
An average is easy to hide behind. The distribution is where the honest information lives.
| Triad | Global Navigator | |
|---|---|---|
| Chained CAGR | 10.22% | 7.20% |
| Median year | 7.60% | 7.19% |
| Best year | 32.76% | 48.42% |
| Worst year | -4.28% | -22.33% |
| Positive years | 38 of 45 (84%) | 31 of 45 (69%) |
| Years above 10% | 21 of 45 | 16 of 45 |
| Standard deviation | 9.77% | 14.27% |
| Avg drawdown during the hold | -5.24% | -7.61% |
| Worst drawdown during the hold | -11.43% | -22.33% |
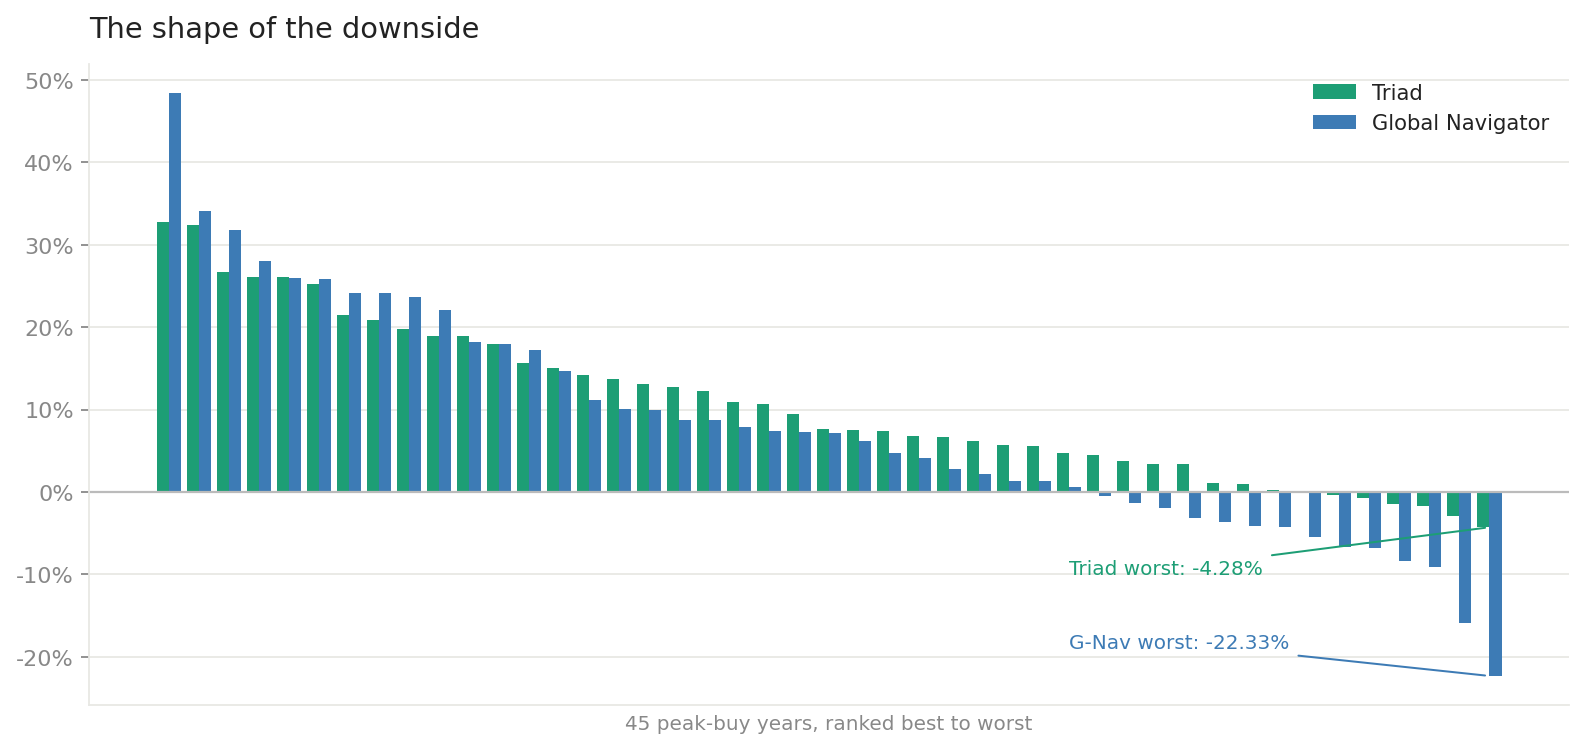
Triad's worst outcome across forty-five deliberately awful entries was -4.28%, from buying in January 2015. Its deepest drawdown at any point inside any of those holding years was -11.43%. Buying Triad at the annual high and holding a year lost money seven times in forty-five tries, and never lost more than about four percent.
Global Navigator's worst was -22.33%, from buying in September 1987 and walking directly into October. Global Navigator concentrates: when it is risk-on, it can be entirely in US large cap. That is the source of its 48% best year and also the source of its 22% worst year. Triad spreads across three sleeves, and the difference shows up exactly where you would expect it to, in the tail.
If you are choosing between the two, this is one of the more useful things to know about them. The headline CAGRs are less than a point apart. The behavior at the worst possible entry is not close.
What good timing was worth
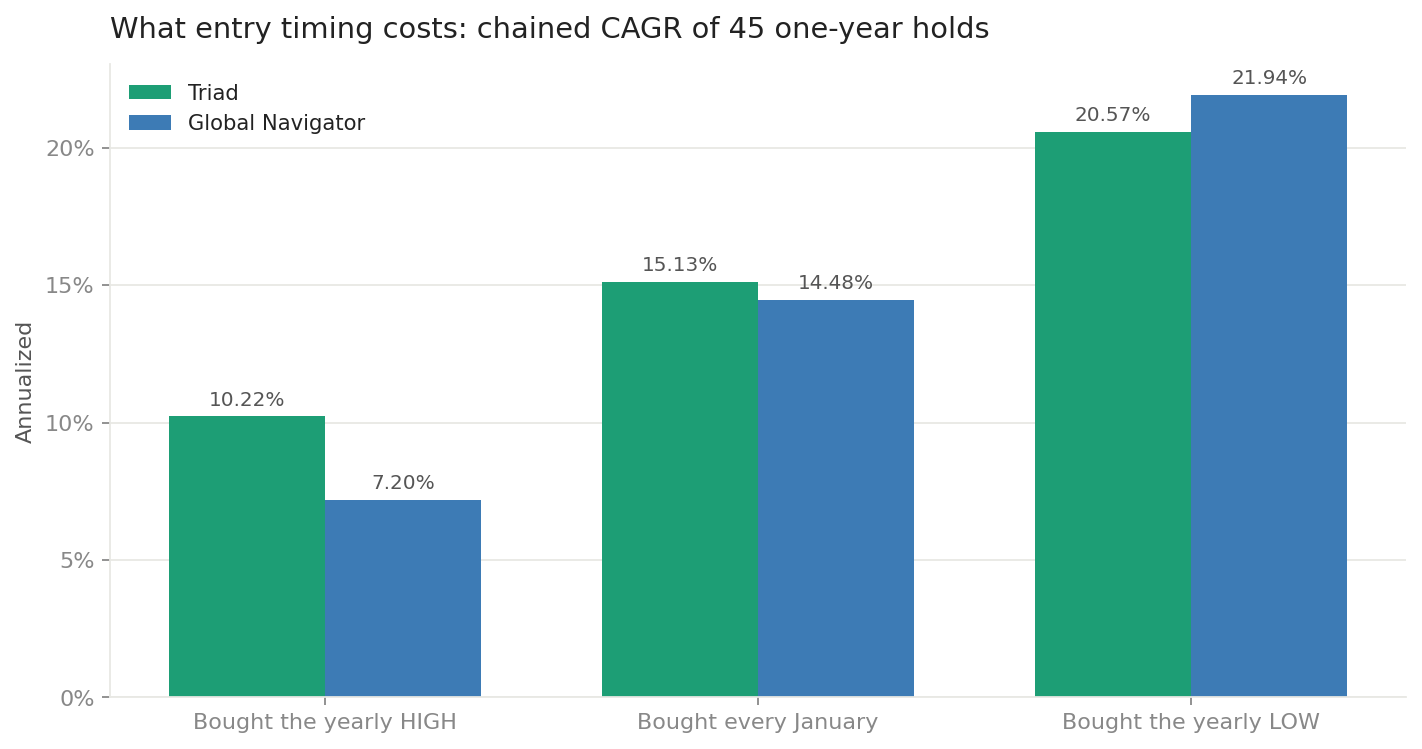
To put the penalty in context, I ran the same forty-five-year chain two other ways: buying every January regardless, and buying each year's low, which is the mirror image of the test and equally impossible in practice.
| Entry rule | Triad | Global Navigator |
|---|---|---|
| Bought the yearly high | 10.22% | 7.20% |
| Bought every January | 15.13% | 14.48% |
| Bought the yearly low | 20.57% | 21.94% |
The January column is the realistic one. It is what you get by not trying, just showing up on a fixed date. Perfect timing adds roughly five to seven points a year over that. Perfect anti-timing subtracts roughly five to seven. Those are large numbers and I would not pretend otherwise.
But notice what the worst column still is. Worst-case entry, every year, for forty-five years, and both strategies still compounded at a rate most investors would sign up for.
Forty-five bad decisions, compounded
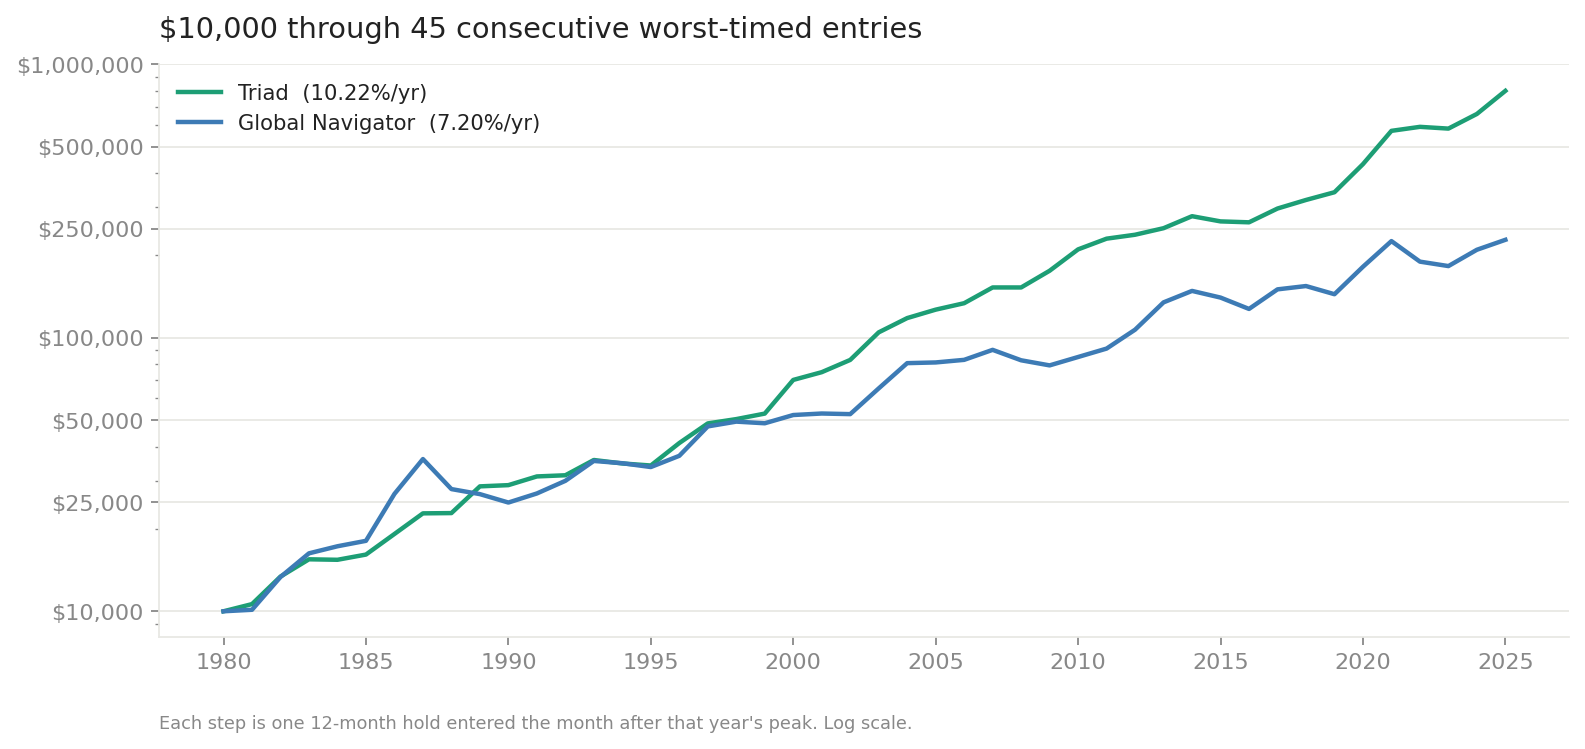
Ten thousand dollars, run through forty-five consecutive worst-timed twelve-month holds, ends at roughly $799,000 in Triad and $228,000 in Global Navigator.
The same ten thousand with mindless January entries ends around $5.66 million and $4.39 million respectively. Timing matters enormously. It just does not matter in the way most people fear it does, which is that one bad entry ruins everything.
By decade
The peak-buy result is not an artifact of one favorable era.
| Decade | Triad | Global Navigator |
|---|---|---|
| 1980s | 11.20% | 9.59% |
| 1990s | 9.26% | 7.64% |
| 2000s | 11.62% | 5.01% |
| 2010s | 7.44% | 7.89% |
| 2020s (5 yrs) | 13.13% | 4.64% |
Triad held between 7.4% and 13.1% in every decade. Global Navigator ranged from 4.6% to 9.6%, with the 2000s and the current decade doing the most damage. Again, concentration.
Method and caveats
A few things to be clear about, because this kind of study is easy to overstate.
The "high" is defined on month-end values, since these are monthly strategies and month-end is the only price at which you could actually have acted. An intramonth high would be a different and less meaningful test.
This is a chain of forty-five independent one-year holdings, not a continuous investment path. The windows overlap in some years and leave gaps in others, depending on where each peak landed. It answers the question "what did the worst-timed entry of that year get you over the next twelve months," which is the question people actually ask. It is not a portfolio you could have held.
2025 and 2026 are excluded because neither has a completed forward year yet. The 2025 high fell in December 2025 and the 2026 high so far is February 2026. August 2026 is dropped as an incomplete month.
Returns are the same monthly series that drives every other number on this site, including trading friction. Nothing here is gross of costs.
And the obvious one: this is history. Both strategies could behave worse in the future than they have in the past, and a forty-five-year sample of anything is smaller than it sounds.
What I take from it
If you are sitting on cash right now, worried that the market feels extended and that today might be the top, the historical answer for these two strategies is that buying the top and waiting a year has been survivable. For Triad it has been survivable to within about four percent in the worst instance out of forty-five. The thing you are afraid of has happened forty-five times in this data and it has never once been the disaster it feels like it would be.
Waiting for a better entry has its own cost, and it is usually larger.
Underlying data for this post, all forty-five entries for both strategies, is available as a CSV.