Short vs Long Term Gains

An investor in DMS strategies asked if I could quantify the effects more gains taxed as long term gains with LT Gain 2X compared to The Russell and the impacts over time.
This investor is saddled with 41% long term and 24% short term tax rates so I used those in the calculations.

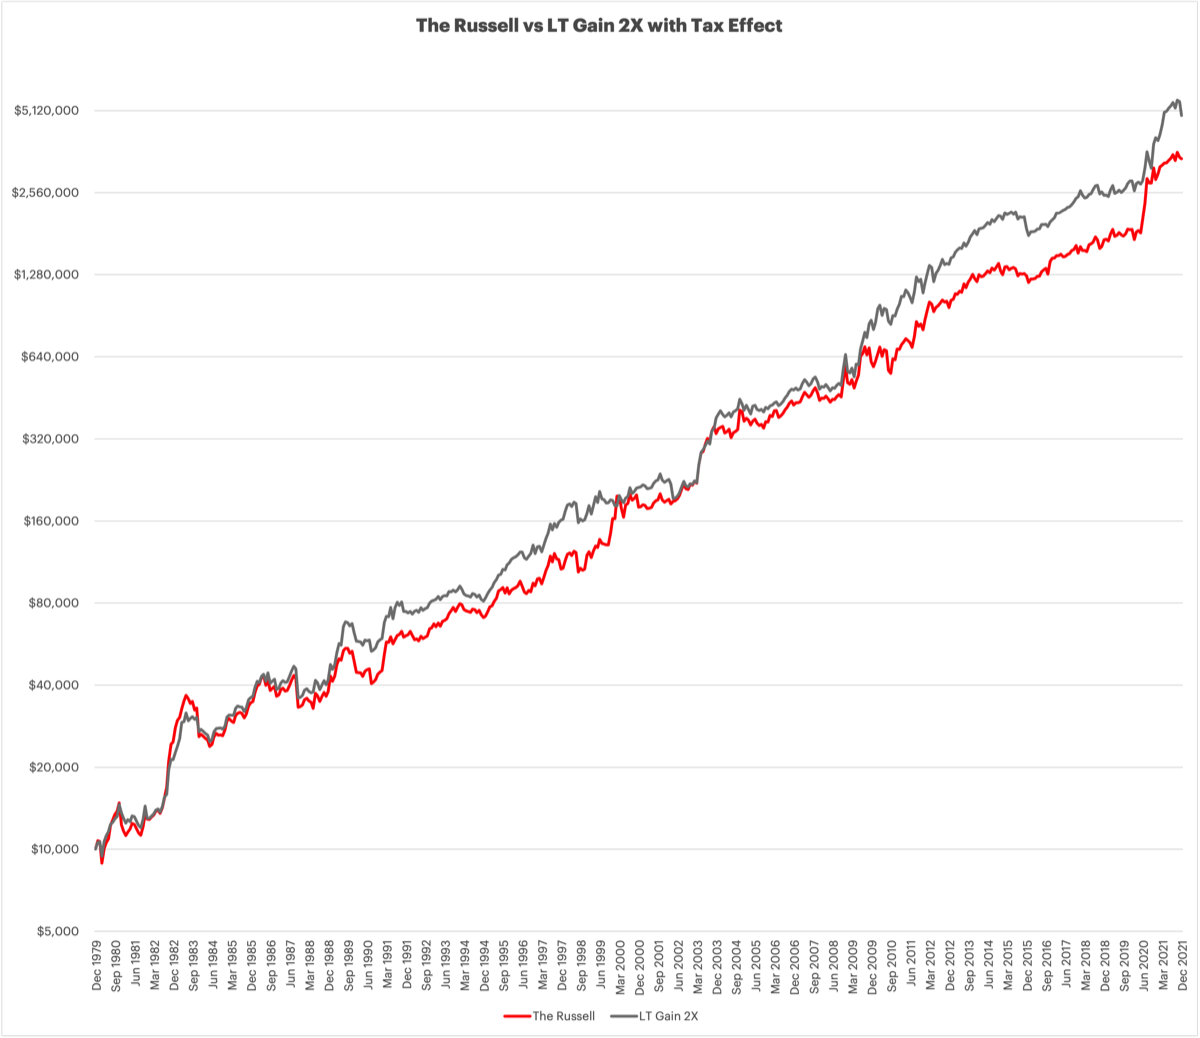
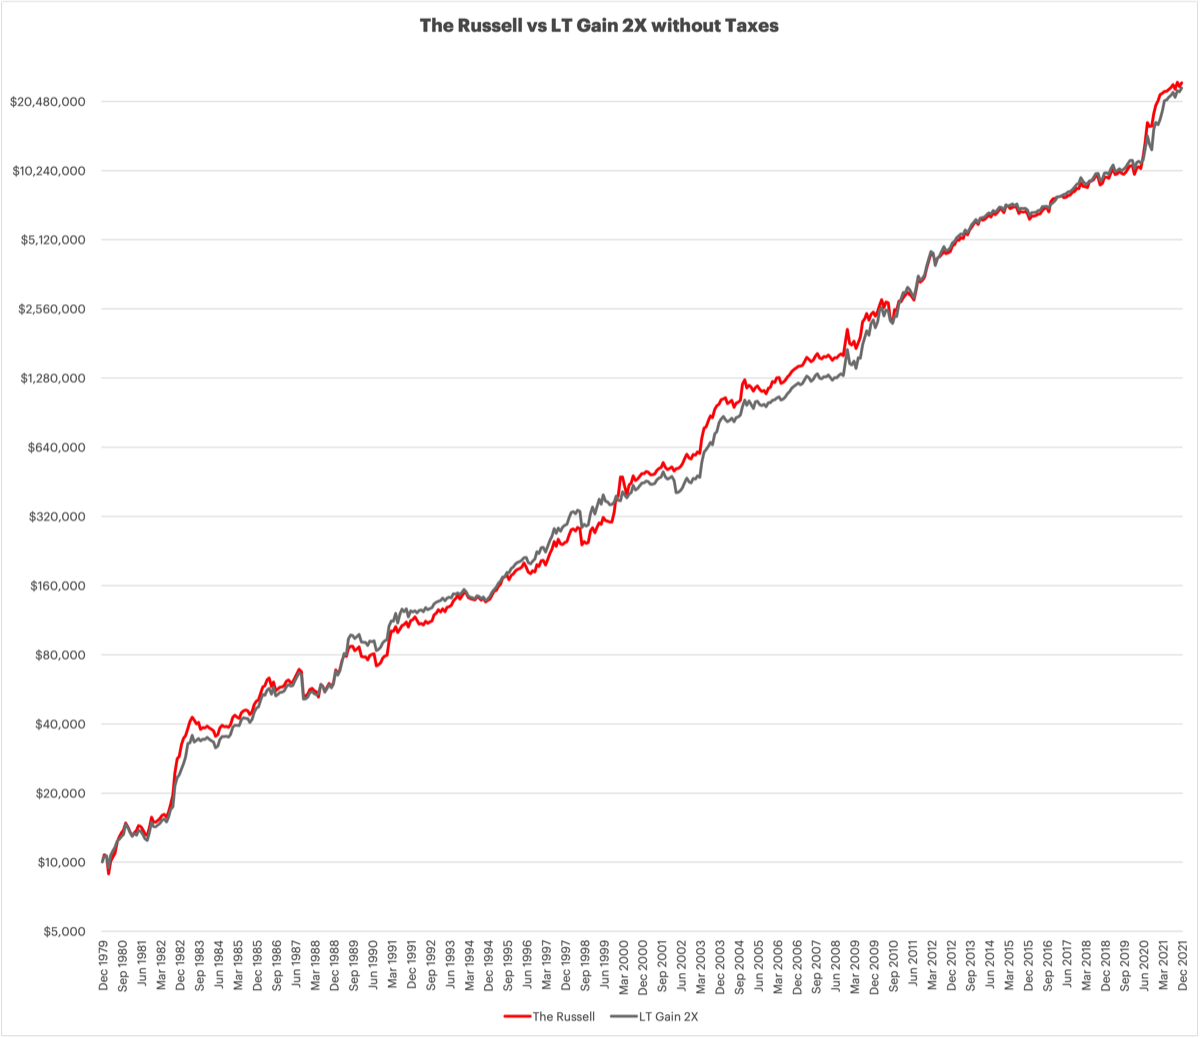
  • Looking at The Russell and LT Gain 2X, not accounting for any taxes, The Russell goes from 1980 through 2021 with a 5.2% higher ending balance than LT Gain 2X.
  • If $1,000 had been invested in The Russell from 1980 through 2021 they would have $3,407,664 at the end. Taxes were taken out at the end of every December, including 2021.
  • If $1,000 had been invested in LT Gain 2X from 1980 through 2021 they would have $4,914,314 at the end. An increase of 44% ending account balance due to the LT Gain 2X strategy having more long term gains.
  • The 44% higher ending balance is over and above the 5.2% lower balance originally in looking at the untaxed strategy returns. Roughly 50% better returns because of the increased long term gains.

For this exercise, current tax rates were extended back in time, this would have been a research project if I tried to figure out what that long and short term tax rates were each year back to 1980, this is more to give an idea as to the benefit of having more gains realized as long term, not an exact calculation on what the actual taxes would have been.


CAGR:

  • The Russell 20.44% untaxed
  • LT Gain 2X 20.29% untaxed

  • The Russell 14.89% taxed
  • LT Gain 2X 15.90% taxed

  • The Russell -27.15% Change in untaxed CAGR to taxed CAGR
  • LT Gain 2X -21.63% Change in untaxed CAGR to taxed CAGR

The increased amount of gains realized as long term makes a profound difference in the ending account balance over time.
The first chart below is the baseline showing how The Russell and LT Gain 2X performed without accounting for any taxes.
Stacks Image 456
This chart shows the impacts of the 41% short term and 24% long term tax rates.
Stacks Image 443

LT Gain Strategies

BIG changes around DMS - out with 3 strategies, in with 2 strategies

I have some accounts which are not tax deferred and I found myself looking at some strategies by other people and per usual started looking at how I could change my strategies to better accomplish more of the gains going to long term instead of short term. The end result is that I am deprecating The Russell, Global Navigator XL, and The Russell XXL and replacing them with two new strategies, LT Gain 2X, and LT Gain 3X.

When presented with new compelling information, I change my mind.

The Russell, looking at results from 1980 through 2021, only has about 12.5% of it's gains as long term, the bulk of the gains are realized as short term. LT Gain 2X has nearly identical performance as The Russell but manages to have nearly 70% of it's gains realized as long term. This does not matter in tax deferred accounts, but it can be a significant difference for invested funds in a regular non-tax deferred account.

The Russell vs LT Gain 2X
Both strategies go into Long Term Treasuries when not invested in equities. The Russell invests in the best relative performer of three options when the general market has upward momentum. The change to LT Gain 2X is instead of looking for the best relative performer, it only goes into the Russell 1000 when it is moving upward, there is no dual momentum here, just [single] momentum. Smart Leverage is still used, and after an outsized month end drawdown in the markets LT Gain 2X will go into SSO which is 2X the S&P 500. This strategy will remain in the leveraged ETF for up to 1 year at which time it exits the leveraged ETF, locks in the long term gains and goes back into the unleveraged Russell 1000. The performance of exiting leverage after 12 months holding is only about 0.5% CAGR lower than not having this 1 year hold filter, and the volatility is noticeably lower, it is a great trade off.

From 1980 through 2021:

CAGR
The Russell 20.44%
LT Gain 2X 20.29%

Sortino Ratio
The Russell 2.20
LT Gain 2X 2.26

Maximum Drawdown
The Russell -24.12%
LT Gain 2X -23.41%

Ulcer Index
The Russell 6.07
LT Gain 2X 5.58

Very similar long term results, and a huge improvement in the amount of gains that are realized as long term instead of short term.

Global Navigator XL & The Russell XXL vs LT Gain 3X
Global Navigator XL goes into Extended Duration Treasuries when out of equities, The Russell XXL goes into 3X Long Term Treasuries the 1st month out of equities, and Extended Duration Treasuries in subsequent months when out of equities. LT Gain 3X uses Extended Duration Treasuries when out of equities.

GN XL and TR XXL each use Smart Leverage going into 3X, as does LT Gain 3X. The new strategy also uses just 1 investment in order to maximize the hold times without switching to the better relative performer, and it pays huge dividends for long term gains, they are nearly 70% instead of the about 15% for GN XL and TR XXL.

From 1980 through 2021:

CAGR
Global Navigator XL 24.46%
The Russell XXL 28.72%
LT Gain 3X 27.17%

Sortino Ratio
Global Navigator XL 2.49
The Russell XXL 2.59
LT Gain 3X 2.40

Maximum Drawdown
Global Navigator XL -28.54%
The Russell XXL -29.49%
LT Gain 3X -28.54%

Ulcer Index
Global Navigator XL 5.45
The Russell XXL 6.9
LT Gain 3X 6.62

And regarding the CAGR, if I slot in TMF for the 1st month out of equities with LT Gain 3X as is done by The Russell XXL, the CAGR for LT Gain 3X goes up to 29.99%, even higher than The Russell XXL and maintaining those excellently high long term gains. I am keeping LT Gain 3X with EDV for all months out of equities, if you want to try and juice your returns a little, you can always go with TMF the first month in Treasuries.
Stacks Image 415
Stacks Image 435
By dropping 3 of the strategies for 2 new strategies, we streamline the strategy offerings a little bit, and otherwise offer very similar strategies with superior long term gains, this is a big win to my eyes, even if the new strategies strictly speaking aren't Dual Momentum, just [single] Momentum. The backtests show that they do not suffer in performance or volatility, we only gain from them without losing anything other than more frequent trades.

Housekeeping note, I will have put a new Reporting Deck for the end of December that reflects the new strategies on the site as well as updated the recent Smart Leverage post from 12/25/2021 to reflect the Smart Leverage history for LT Gain 3X instead of Global Navigator XL.

Smart Leverage

Smart Leverage: What is it, how does it work, and how successful has it been?

DMS has 6 strategies in total. Triad and The Russell OG don't ever use leverage ever. MAX PAIN is the most aggressive and volatile strategy, it is always in 3X Funds. The other 3 funds are normally in 1X, unleveraged funds, but use Smart Leverage. These funds are: Global Navigator, LT Gain 2X and LT Gain 3X.

Smart Leverage is used to take advantage when the odds are in our favor, to go big with Leveraged ETF's. When there is a bigger than normal drop in the markets on a month end basis, the 3 funds which use Smart Leverage will go from 1X funds into Leveraged Funds. Global Navigator and LT Gain 2X go to 2X funds, and LT Gain 3X goes into 3X funds.

Smart Leverage does not kick in often, it is selective and rules based. I will show the results for all three strategies which use Smart Leverage.
Stacks Image 345
Stacks Image 425
Global Navigator used Smart Leverage a total of 10 times from 1970 through 2021, and for a total of 56 months out of 624 months, 9% of the time. Only 1 of the 10 periods did Smart Leverage perform worse than had you been in a regular 1X unleveraged fund. There was a huge improvement in overall results from using Smart Leverage for Global Navigator.


The two LT Gain strategies took advantage of Smart Leverage 13 times from 1980 through 2021, for a total of 114 months, 22.6% of the time. These strategies go into Smart Leverage more than Global Navigator since there isn't a suitable Foreign leveraged ETF with enough volume to use in that strategy, so it only leverages up with the US Market, not Foreign. The LT Gain strategies had 11 instances of positive and better than 1X investments, and two periods with negative returns which were also greater than the 1X losses. If we invested $1 during these time periods of Smart Leverage, the unleveraged 1X investments would have grown to $9.79, while the 2X Smart Leverage grew to $53.34, and the 3X to $300.27. Tremendous improvements in gains.


Smart Leverage has dramatically improved the strategy results in the past, however, it is by no means guaranteed to work in the future and by using leverage could cause rather large drawdowns if the market turns negative while in leveraged funds. Caution is advised, as is choosing an allocation that you are comfortable with.

November 2021 Results

The volatility continued in November, will we see a Santa Claus Rally?
The strategies and markets were on target for a slight gain for the month, and then Omicron fears hit the market on November 30 and we had a big down down.

There were changes in Triad and The Russell strategies, see the full report for the details.

October 2021 Results, and November 2021 Investments

September was no bueno! However, October was Fantastico!
The strategies and markets had a very good October, earning back well more than the loses from last month. Triad dropped the Russell Mid-Cap Value ETF [IWS] for October which was unfortunate because it had a great month. See the previous post about FOMO regarding this.

October was still a volatile month, but how we more appreciate it - to the upside. Two months left in the year, we will have to wait and see what is in store.


November Investment Changes:
Triad goes back into IWS, no other changes for any of the other strategies.

See the November 2021 investments and October 2021 results, and link to the full reporting deck here.

Triad October FOMO

September was a big down month in the markets and as a result the Triad strategy exited it's position in the Russell Mid-Cap Value [IWS] (it did maintain it's holding in the Russell 1000 [IWB].)

FOMO: Fear Of Missing Out

October has been a booming month so far in the markets, and IWS is up almost 4.5%, this means that Triad would have realized an additional 1.5% gain this month if it had maintained the position in IWS.

Let's take a look below at how the Triad equity positions do over time when compared to a Buy & Hold approach and see if there is reason to justify FOMO.
Stacks Image 254
The blue line in the chart above of the Russell 1000 [IWB] buy and hold equity line. The golden colored line is Triad's holding in IWB when it's lookback methodology says to be in IWB, and alternatively in bonds when it says to be out of equities.

Without running the metrics, we can visually see that the Triad line is far less volatile than is the Russell 1000 line, especially with regard to the two large drawdowns in the IWB. We can see that in the 1990's buy and hold outperformed Triad's methodology, but the two equalized after the 1990 boom and then early 2000's bust, and when we get to the 2008 drop in the markets - we witness IWB taking a massive dive but Triad only has a dip and keeps moving upward.

Yes there are period of time when the B&H in IWB outperform Triad's IWB position, but with far greater downside risk and higher overall volatility.

Below we will compare the Russell Mid-Cap Value B&H vs Triad.
Stacks Image 268
Overall this is very similar to the IWB chart above. MidCap Value saw less of an outsized return in the 1990's, but similar to the Russell 1000 the Russell Mid-Cap Value also have a major drubbing in the 2008 market dump, but Triad's strategy of being in equities when it sees upside performance, and in Bonds when the equities are not seeing upside performance results in less volatile results and avoids the major drawdown of market meltdowns.

It's ok to be a little sad that you missed out on a bit of extra gain this month in Triad. Just keep in mind that long term Triad gets the calls far more right than wrong which result in better performance with less volatility - no reason for FOMO.